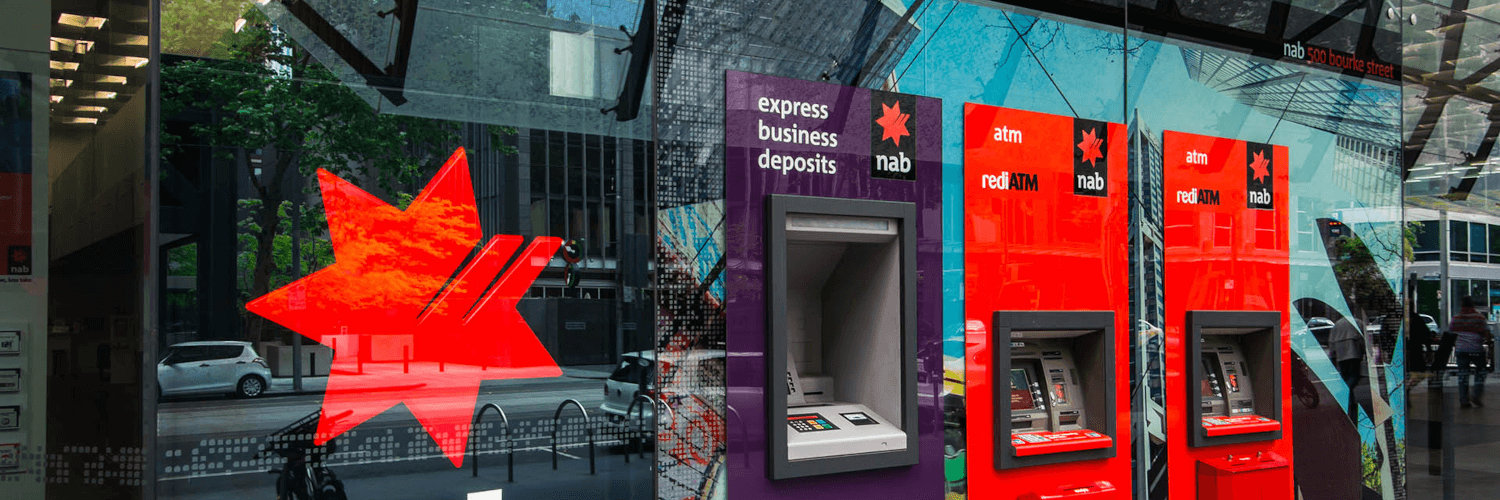
National Australia Bank Ltd
ASX:NAB

Decide at what price you'd be comfortable buying and we'll help you stay ready.

|
National Australia Bank Ltd
ASX:NAB
|
AU |

|
ESR-Logos REIT
F:UZ0
|
SG |
|
M
|
Muenchener Rueckversicherungs Gesellschaft in Muenchen AG
MIL:1MUV2
|
DE |
|
S
|
Sealed Air Corp
DUS:SDA
|
US |
|
N
|
Novavax Inc
F:NVV1
|
US |
|
F
|
Fresenius Medical Care AG & Co KGaA
XETRA:FME
|
DE |
|
D
|
Deliveroo PLC
F:926
|
UK |
|
E
|
Exploits Discovery Corp
F:634
|
CA |
|
C
|
CSP International Fashion Group SpA
F:IIT
|
IT |
|
N
|
Navient Corp
F:10D
|
US |
|
C
|
Cdon AB
F:64W
|
SE |
|
B
|
Beiersdorf AG
F:BEI
|
DE |
|
H
|
Huntington Ingalls Industries Inc
F:HI4
|
US |
|
T
|
TravelSky Technology Ltd
F:TVL
|
CN |

|
Stylam Industries Ltd
BSE:526951
|
IN |
Profitability Summary
National Australia Bank Ltd's profitability score is Hidden . We take all the information about a company's profitability, such as its margins, capital efficiency, free cash flow generating ability, and more, and consolidate it into one single number: the profitability score. The higher the profitability score, the more profitable the company is.
Profitability Score
We take all the information about a company's profitability, such as its margins, capital efficiency, free cash flow generating ability, and more, and consolidate it into one single number: the profitability score. The higher the profitability score, the more profitable the company is.
We take all the information about a company's profitability, such as its margins, capital efficiency, free cash flow generating ability, and more, and consolidate it into one single number: the profitability score. The higher the profitability score, the more profitable the company is.
Profitability Score
