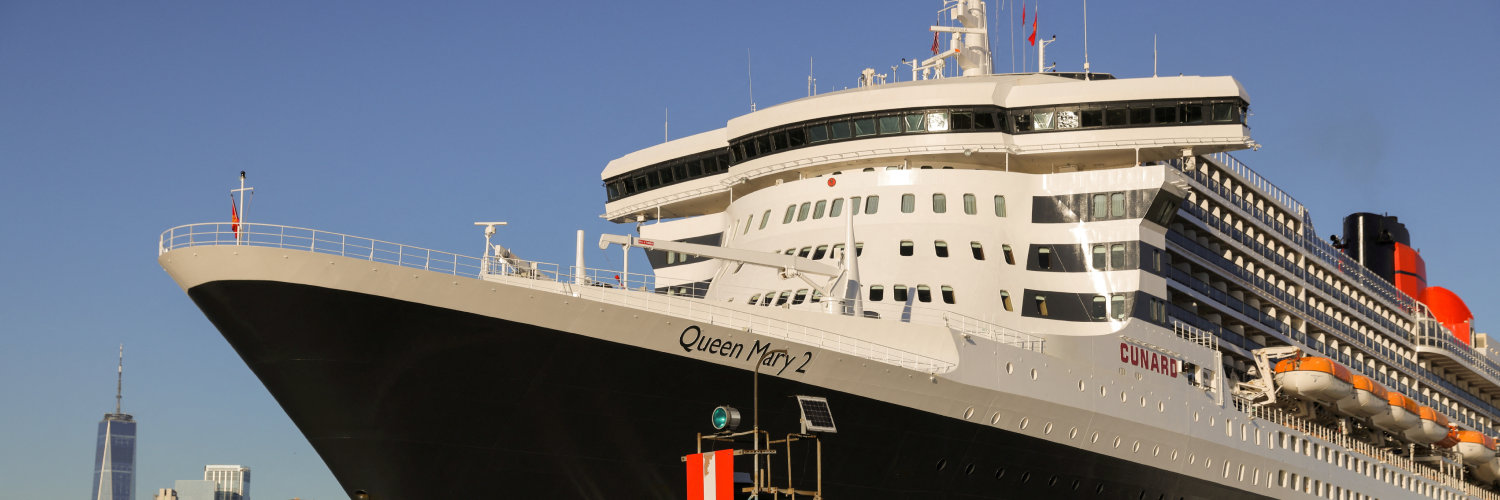
Carnival PLC
LSE:CCL

Watchlist Manager
Carnival PLC Logo
Carnival PLC
LSE:CCL
Watchlist
Price: 1 481 GBX -0.74% Market Closed
Market Cap: 20.1B GBX

Profitability Summary

We take all the information about a company's profitability (such as its margins, capital efficiency, free cash flow generating ability, and more) and consolidate it into one single number - the profitability score. The higher the profitability score, the more profitable the company is.

Past Growth

Analyzing past growth in Revenue, Operating Income, and Net Income allows investors to assess the company's profitability and operational efficiency. Consistent improvement in these metrics typically signals long-term strength and stability.

Show More Less

Margins

Profit margins represent what percentage of sales has turned into profits. Simply put, the percentage figure indicates how many cents of profit the company has generated for each dollar of sale.

Profit margins help investors assess if a company's management is generating enough profit from its sales and whether operating costs and overhead costs are being contained.

Show More Less

Earnings Waterfall
Carnival PLC

Revenue
25.4B USD
Cost of Revenue
-15.7B USD
Gross Profit
9.7B USD
Operating Expenses
-5.9B USD
Operating Income
3.8B USD
Other Expenses
-1.8B USD
Net Income
2.1B USD

Margins Comparison
Carnival PLC Competitors

Country Company Market Cap Gross
Margin
Operating
Margin
Net
Margin
UK
Carnival PLC
LSE:CCL
19.4B GBP
38%
15%
8%
US
Booking Holdings Inc
NASDAQ:BKNG
174.4B USD
0%
33%
23%
CN
H World Group Ltd
BMV:HTHTN
2.7T MXN
67%
22%
13%
US
Airbnb Inc
NASDAQ:ABNB
79.6B USD
71%
22%
23%
US
Marriott International Inc
NASDAQ:MAR
70.9B USD
20%
15%
10%
US
Royal Caribbean Cruises Ltd
NYSE:RCL
65.2B USD
50%
26%
19%
US
Hilton Worldwide Holdings Inc
NYSE:HLT
58.4B USD
37%
21%
14%
CN
Trip.com Group Ltd
HKEX:9961
318.5B HKD
81%
27%
32%
US
Carnival Corp
NYSE:CCL
29.2B USD
53%
15%
8%
US
Expedia Group Inc
NASDAQ:EXPE
20.3B USD
90%
12%
8%
US
Viking Holdings Ltd
NYSE:VIK
19.4B USD
42%
21%
9%

Return on Capital

Return on capital ratios give a sense of how well a company is using its capital (equity, assets, capital employed, etc.) to generate profits (operating income, net income, etc.). In simple words, these ratios show how much income is generated for each dollar of capital invested.

Show More Less

Return on Capital Comparison
Carnival PLC Competitors

Country Company Market Cap ROE ROA ROCE ROIC
UK
Carnival PLC
LSE:CCL
19.4B GBP
26%
4%
10%
8%
US
Booking Holdings Inc
NASDAQ:BKNG
174.4B USD
-107%
20%
73%
76%
CN
H World Group Ltd
BMV:HTHTN
2.7T MXN
25%
5%
11%
7%
US
Airbnb Inc
NASDAQ:ABNB
79.6B USD
32%
10%
27%
45%
US
Marriott International Inc
NASDAQ:MAR
70.9B USD
-104%
9%
22%
12%
US
Royal Caribbean Cruises Ltd
NYSE:RCL
65.2B USD
50%
9%
16%
12%
US
Hilton Worldwide Holdings Inc
NYSE:HLT
58.4B USD
-44%
10%
20%
16%
CN
Trip.com Group Ltd
HKEX:9961
318.5B HKD
13%
7%
9%
8%
US
Carnival Corp
NYSE:CCL
29.2B USD
26%
4%
10%
8%
US
Expedia Group Inc
NASDAQ:EXPE
20.3B USD
119%
5%
20%
8%
US
Viking Holdings Ltd
NYSE:VIK
19.4B USD
-17%
5%
26%
15%

Free Cash Flow

Free cash flow (FCF) is the money a company has left over after paying its operating expenses and capital expenditures. The more free cash flow a company has, the more it can allocate to dividends, paying down debt, and growth opportunities.

If a company has a decreasing free cash flow, that is not necessarily bad if the company is investing in its growth.

Show More Less