
CH Robinson Worldwide Inc
NASDAQ:CHRW

Decide at what price you'd be comfortable buying and we'll help you stay ready.

|
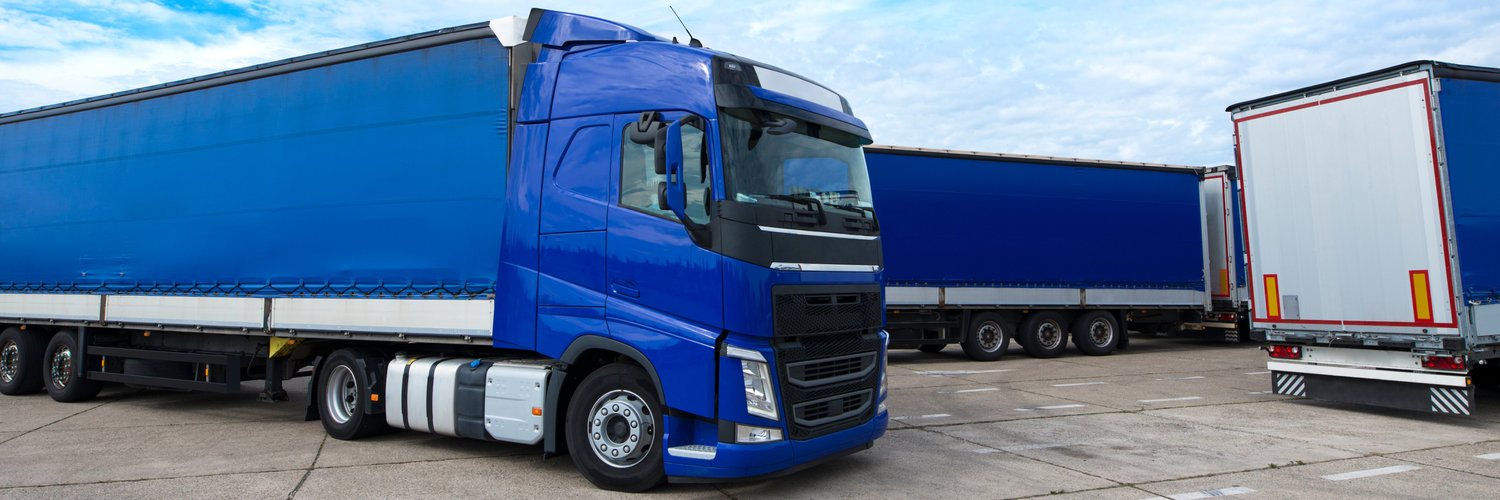
CH Robinson Worldwide Inc
NASDAQ:CHRW
|
US |

|
AGNC Investment Corp
NASDAQ:AGNC
|
US |
|
G
|
GATX Corp
F:GAX
|
US |

|
Toyota Boshoku Corp
OTC:TDBOY
|
JP |
|
T
|
Tejas Networks Ltd
BSE:540595
|
IN |
|
S
|
Semiconductor Manufacturing International Corp
F:MKN2
|
CN |
|
C
|
Capgemini SE
LSE:0HAZ
|
FR |
|
C
|
Comp SA
WSE:CMP
|
PL |

|
Hokuriku Electric Power Co
OTC:HOKRF
|
JP |

|
CK Hutchison Holdings Ltd
HKEX:1
|
HK |
|
A
|
Acea SpA
XMUN:DCA
|
IT |

|
Perella Weinberg Partners
NASDAQ:PWP
|
US |

|
Americas Gold and Silver Corporation
F:SZ7
|
CA |
|
F
|
Forus SA
SGO:FORUS
|
CL |
|
S
|
Shyft Group Inc
F:SP8
|
US |
|
V
|
Vanquis Banking Group PLC
DUS:PRVA
|
UK |

|
Red Robin Gourmet Burgers Inc
NASDAQ:RRGB
|
US |
Profitability Summary
CH Robinson Worldwide Inc's profitability score is Hidden . We take all the information about a company's profitability, such as its margins, capital efficiency, free cash flow generating ability, and more, and consolidate it into one single number: the profitability score. The higher the profitability score, the more profitable the company is.
Profitability Score
We take all the information about a company's profitability, such as its margins, capital efficiency, free cash flow generating ability, and more, and consolidate it into one single number: the profitability score. The higher the profitability score, the more profitable the company is.
We take all the information about a company's profitability, such as its margins, capital efficiency, free cash flow generating ability, and more, and consolidate it into one single number: the profitability score. The higher the profitability score, the more profitable the company is.
Profitability Score
