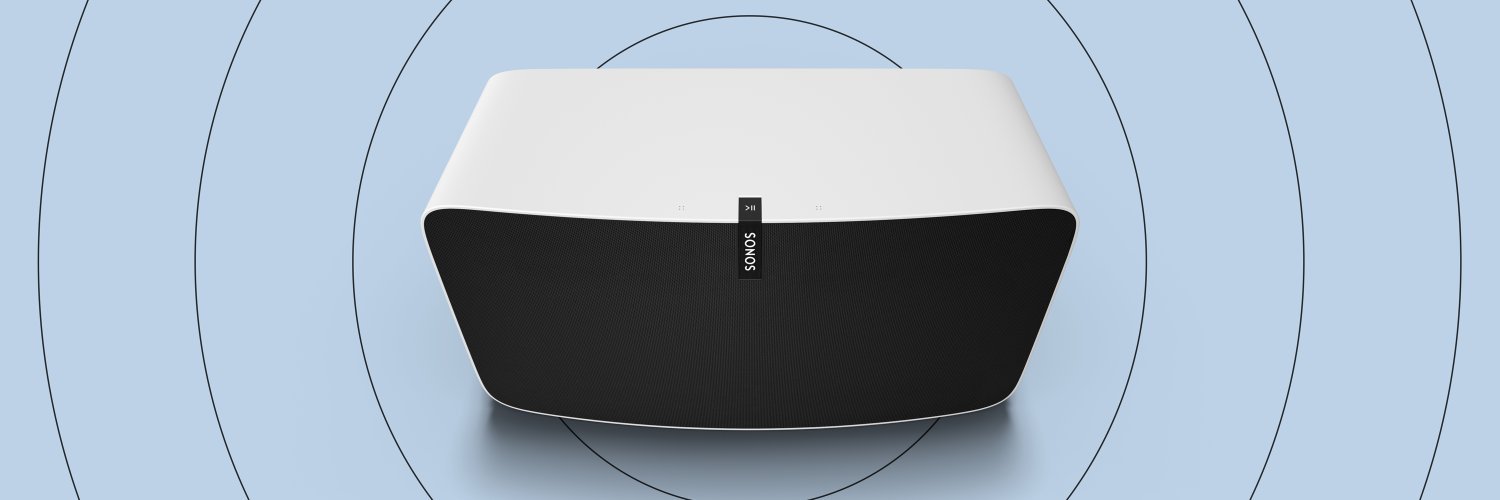

Sonos Inc
NASDAQ:SONO

Decide at what price you'd be comfortable buying and we'll help you stay ready.

|
Johnson & Johnson
NYSE:JNJ
|
US |

|
Berkshire Hathaway Inc
NYSE:BRK.A
|
US |

|
Bank of America Corp
NYSE:BAC
|
US |

|
Mastercard Inc
NYSE:MA
|
US |

|
UnitedHealth Group Inc
NYSE:UNH
|
US |

|
Exxon Mobil Corp
NYSE:XOM
|
US |

|
Pfizer Inc
NYSE:PFE
|
US |

|
Nike Inc
NYSE:NKE
|
US |

|
Visa Inc
NYSE:V
|
US |

|
Alibaba Group Holding Ltd
NYSE:BABA
|
CN |

|
JPMorgan Chase & Co
NYSE:JPM
|
US |

|
Coca-Cola Co
NYSE:KO
|
US |

|
Verizon Communications Inc
NYSE:VZ
|
US |

|
Chevron Corp
NYSE:CVX
|
US |

|
Walt Disney Co
NYSE:DIS
|
US |

|
PayPal Holdings Inc
NASDAQ:PYPL
|
US |
 Sonos Inc
Selling, General & Administrative
Sonos Inc
Selling, General & Administrative
Sonos Inc
Selling, General & Administrative Peer Comparison
Competitors Analysis
Latest Figures & CAGR of Competitors
| Company | Selling, General & Administrative | CAGR 3Y | CAGR 5Y | CAGR 10Y | ||
|---|---|---|---|---|---|---|
|
|
Sonos Inc
NASDAQ:SONO
|
Selling, General & Administrative
-$364.3m
|
CAGR 3-Years
7%
|
CAGR 5-Years
0%
|
CAGR 10-Years
N/A
|
|

|
Vuzix Corp
NASDAQ:VUZI
|
Selling, General & Administrative
-$17.1m
|
CAGR 3-Years
16%
|
CAGR 5-Years
-9%
|
CAGR 10-Years
-8%
|
|

|
GoPro Inc
NASDAQ:GPRO
|
Selling, General & Administrative
-$147.5m
|
CAGR 3-Years
13%
|
CAGR 5-Years
6%
|
CAGR 10-Years
9%
|
|
|
Koss Corp
NASDAQ:KOSS
|
Selling, General & Administrative
-$6.4m
|
CAGR 3-Years
39%
|
CAGR 5-Years
-1%
|
CAGR 10-Years
2%
|
|

|
Universal Electronics Inc
NASDAQ:UEIC
|
Selling, General & Administrative
-$81m
|
CAGR 3-Years
7%
|
CAGR 5-Years
4%
|
CAGR 10-Years
3%
|
|

|
VOXX International Corp
NASDAQ:VOXX
|
Selling, General & Administrative
-$104.1m
|
CAGR 3-Years
6%
|
CAGR 5-Years
1%
|
CAGR 10-Years
5%
|
|
Sonos Inc
Glance View
In the ever-evolving world of audio technology, Sonos Inc. has carved a niche for itself as a pioneering force dedicated to delivering superior sound experiences. Founded in 2002 in Santa Barbara, California, Sonos quickly became an innovator in the realm of home audio systems by offering an unprecedented ability to wirelessly stream music throughout one's home. What set Sonos apart was its strategic focus on creating modular, high-quality speakers that seamlessly integrate into various living spaces. This adaptability, combined with intuitive software, has enabled users to customize their listening experiences via a simple app interface, thereby enhancing the customer value proposition. The company's ecosystem does not just end at hardware but extends to software and services, such as partnerships with major music streaming services, which allow for almost limitless musical access. Financially, Sonos sustains its business model by generating revenue through the sale of its stylish and technologically advanced audio products, complemented by a growing array of services. Its portfolio includes soundbars, subwoofers, and portable speakers, all of which appeal to both audiophiles and casual listeners alike. By emphasizing high-quality design and user-friendly functionality, Sonos has managed to cultivate a dedicated and expanding customer base. Moreover, the company's investments in research and development have allowed it to stay ahead of industry trends, continually updating its line-up to incorporate the latest technological advancements. The strategy of continuously enriching its product ecosystem and maintaining robust entry into international markets has ensured the company a steady stream of income, underpinned by a loyal clientele that appreciates cutting-edge, wireless, multi-room sound experiences.
See Also
What is Sonos Inc's Selling, General & Administrative?
Selling, General & Administrative
-364.3m
USD
Based on the financial report for Dec 27, 2025, Sonos Inc's Selling, General & Administrative amounts to -364.3m USD.
What is Sonos Inc's Selling, General & Administrative growth rate?
Selling, General & Administrative CAGR 5Y
0%
Over the last year, the Selling, General & Administrative growth was 12%. The average annual Selling, General & Administrative growth rates for Sonos Inc have been 7% over the past three years .
