
Deere & Co
NYSE:DE

Decide at what price you'd be comfortable buying and we'll help you stay ready.

|
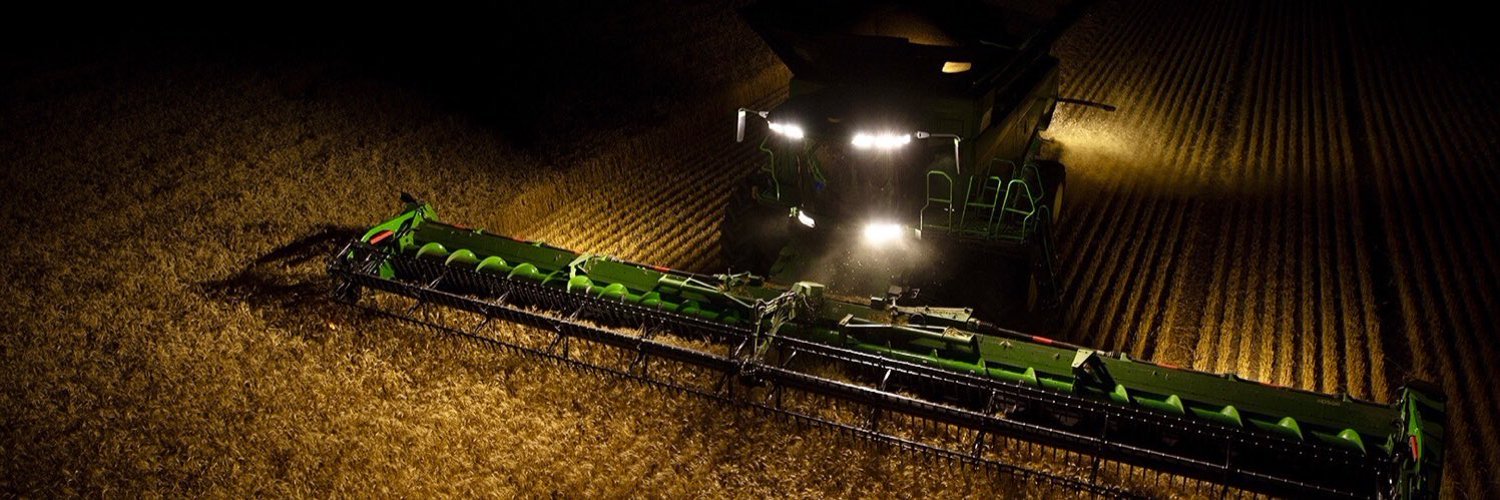
Deere & Co
NYSE:DE
|
US |
|
I
|
IONOS Group SE
DUS:IOS
|
DE |
|
T
|
TDK Corp
XMUN:TDK
|
JP |
|
P
|
Popular Inc
F:PP4A
|
PR |
Profitability Summary
Deere & Co's profitability score is Hidden . We take all the information about a company's profitability, such as its margins, capital efficiency, free cash flow generating ability, and more, and consolidate it into one single number: the profitability score. The higher the profitability score, the more profitable the company is.
Profitability Score
We take all the information about a company's profitability, such as its margins, capital efficiency, free cash flow generating ability, and more, and consolidate it into one single number: the profitability score. The higher the profitability score, the more profitable the company is.
We take all the information about a company's profitability, such as its margins, capital efficiency, free cash flow generating ability, and more, and consolidate it into one single number: the profitability score. The higher the profitability score, the more profitable the company is.
Profitability Score
