
Olin Corp
NYSE:OLN

Decide at what price you'd be comfortable buying and we'll help you stay ready.

|
Johnson & Johnson
NYSE:JNJ
|
US |

|
Berkshire Hathaway Inc
NYSE:BRK.A
|
US |

|
Bank of America Corp
NYSE:BAC
|
US |

|
Mastercard Inc
NYSE:MA
|
US |

|
UnitedHealth Group Inc
NYSE:UNH
|
US |

|
Exxon Mobil Corp
NYSE:XOM
|
US |

|
Pfizer Inc
NYSE:PFE
|
US |

|
Nike Inc
NYSE:NKE
|
US |

|
Visa Inc
NYSE:V
|
US |

|
Alibaba Group Holding Ltd
NYSE:BABA
|
CN |

|
JPMorgan Chase & Co
NYSE:JPM
|
US |

|
Coca-Cola Co
NYSE:KO
|
US |

|
Verizon Communications Inc
NYSE:VZ
|
US |

|
Chevron Corp
NYSE:CVX
|
US |

|
Walt Disney Co
NYSE:DIS
|
US |

|
PayPal Holdings Inc
NASDAQ:PYPL
|
US |
P/OCF
Price to Operating Cash Flow (P/OCF) ratio compares a company`s market value to the cash it generates from its core operations.
Price to Operating Cash Flow (P/OCF) ratio compares a company`s market value to the cash it generates from its core operations.
Valuation Scenarios
If P/OCF returns to its 3-Year Average (6.1), the stock would be worth $25.56 (3% downside from current price).
| Scenario | P/OCF Value | Implied Price | Upside/Downside |
|---|---|---|---|
| Current Multiple | 6.3 | $26.22 |
0%
|
| 3-Year Average | 6.1 | $25.56 |
-3%
|
| 5-Year Average | 6 | $25.28 |
-4%
|
| Industry Average | 12.5 | $52.62 |
+101%
|
| Country Average | 13.3 | $55.94 |
+113%
|
Forward P/OCF
Today’s price vs future operating cash flow
Peer Comparison
| Market Cap | P/OCF | P/E | ||||
|---|---|---|---|---|---|---|
| US |

|
Olin Corp
NYSE:OLN
|
3B USD | 6.3 | -29.5 | |
| SA |

|
Saudi Basic Industries Corporation SJSC
SAU:2010
|
228.3B SAR | 14.3 | -8.8 | |
| ID |

|
Chandra Asri Pacific PT Tbk
OTC:PTPIF
|
45.6B USD | 130.2 | 41.8 | |
| ID |

|
Chandra Asri Petrochemical Tbk PT
IDX:TPIA
|
523.3T IDR | 88.4 | 28.4 | |
| US |

|
Dow Inc
NYSE:DOW
|
27.6B USD | 26.6 | -10.4 | |
| CN |

|
Hengli Petrochemical Co Ltd
SSE:600346
|
169.8B CNY | 6.1 | 19 | |
| UK |

|
LyondellBasell Industries NV
NYSE:LYB
|
22.8B USD | 10.1 | -30.3 | |
| TW |

|
Nan Ya Plastics Corp
TWSE:1303
|
675.7B TWD | 78.1 | 149.5 | |
| KR |

|
LG Chem Ltd
KRX:051910
|
30.6T KRW | 3.7 | -16.8 | |
| CN |

|
Rongsheng Petrochemical Co Ltd
SZSE:002493
|
118.8B CNY | 3.1 | 161.3 | |
| IN |

|
Solar Industries India Ltd
NSE:SOLARINDS
|
1.4T INR | 68.8 | 93.9 |
Market Distribution
| Min | 0 |
| 30th Percentile | 8.8 |
| Median | 13.3 |
| 70th Percentile | 20.1 |
| Max | 3 188 432.5 |
Other Multiples
Olin Corp
Glance View
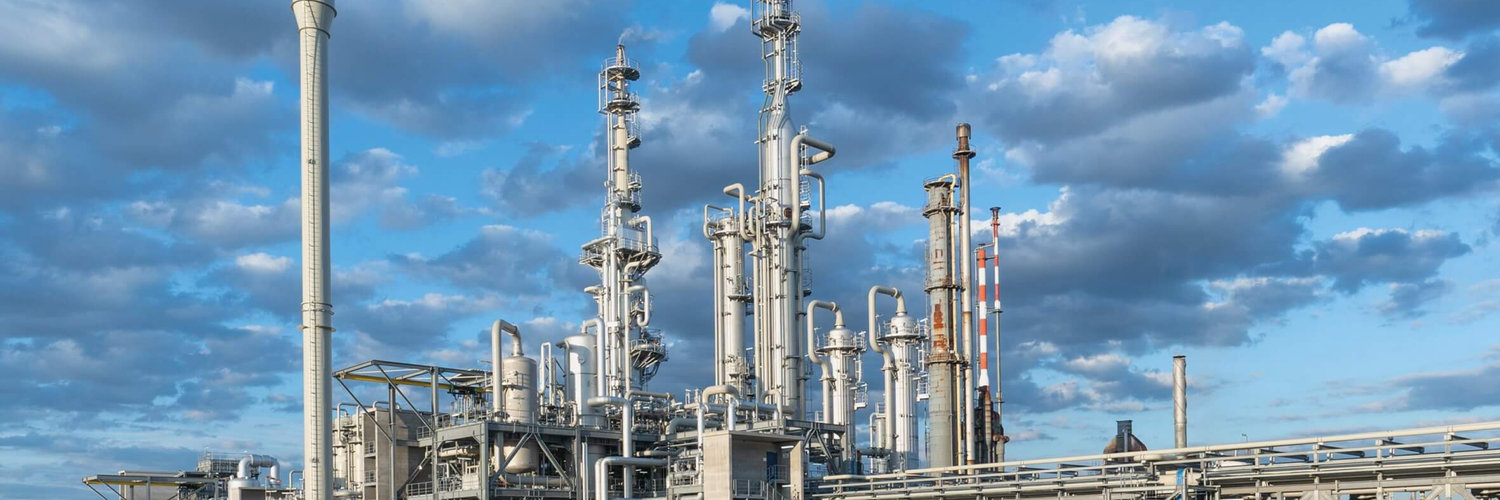
Founded over a century ago, Olin Corporation stands as a stalwart in the chemicals and ammunition industries, a testament to its resilience and adaptability amidst evolving market dynamics. This American manufacturing company originally made its mark in the ammunition business, a legacy that remains central to its identity. Olin’s Winchester brand is synonymous with reliability and tradition, supplying ammunition for sports, hunting, and the military. This segment still generates significant revenue, benefiting from both civilian demand and government contracts, thereby ensuring a steady cash flow source. However, Olin is not just about ammunition; it has expanded its scope to embrace the chemical sector, a strategic pivot that underscores its growth trajectory. The company operates through three primary business segments: Chlor Alkali Products and Vinyls, Epoxy, and Winchester. The chemical divisions provide essential materials for various industries — from pulp and paper to electronics and automotive sectors. By producing and distributing chlorine, caustic soda, and other chemical derivatives, Olin capitalizes on the vital role these chemicals play in manufacturing and consumer goods. This diversification allows Olin to mitigate risks associated with cyclical downturns in any one industry, while also capturing opportunities from global industrial demands. Through this dual focus on ammunition and chemicals, Olin ensures a balanced portfolio that harmonizes heritage with innovation.
