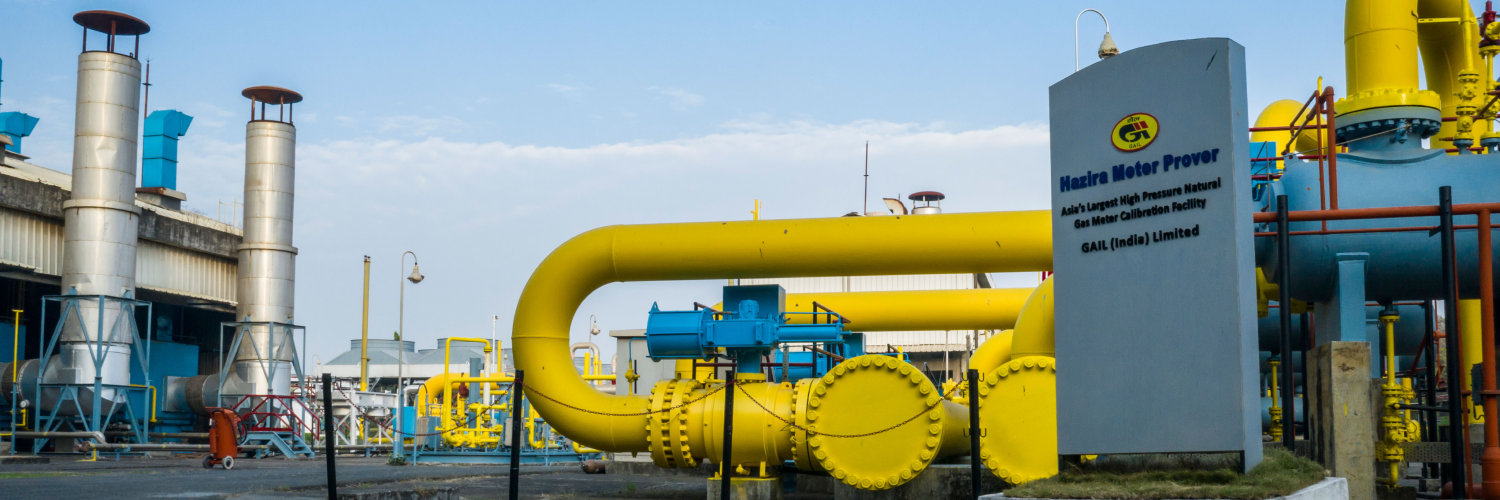

GAIL (India) Ltd
OTC:GAILF
Net Margin
Net Margin shows how much profit a company keeps from each dollar of sales after all expenses, including taxes and interest. It reflects the company`s overall profitability.
Net Margin shows how much profit a company keeps from each dollar of sales after all expenses, including taxes and interest. It reflects the company`s overall profitability.
Peer Comparison
| Country | Company | Market Cap |
Net Margin |
||
|---|---|---|---|---|---|
| IN |

|
GAIL (India) Ltd
NSE:GAIL
|
1.1T INR |
Loading...
|
|
| ES |

|
Naturgy Energy Group SA
MAD:NTGY
|
25.6B EUR |
Loading...
|
|
| US |

|
Atmos Energy Corp
NYSE:ATO
|
27.7B USD |
Loading...
|
|
| IT |

|
Snam SpA
MIL:SRG
|
20.1B EUR |
Loading...
|
|
| HK |

|
Hong Kong and China Gas Co Ltd
HKEX:3
|
141.3B HKD |
Loading...
|
|
| JP |

|
Osaka Gas Co Ltd
TSE:9532
|
2.5T JPY |
Loading...
|
|
| JP |
T
|
Tokyo Gas Co Ltd
TSE:9531
|
2.5T JPY |
Loading...
|
|
| IT |

|
Italgas SpA
MIL:IG
|
10.6B EUR |
Loading...
|
|
| VN |
P
|
Petrovietnam Gas Joint Stock Corp
VN:GAS
|
270T VND |
Loading...
|
|
| CN |

|
ENN Energy Holdings Ltd
HKEX:2688
|
77B HKD |
Loading...
|
|
| CA |

|
AltaGas Ltd
TSX:ALA
|
12.7B CAD |
Loading...
|
Market Distribution
| Min | -305 007.7% |
| 30th Percentile | 2.1% |
| Median | 5.8% |
| 70th Percentile | 11.6% |
| Max | 1 221 633.3% |
Other Profitability Ratios
GAIL (India) Ltd
Glance View
GAIL (India) Ltd., the country's premier natural gas infrastructure company, weaves a dynamic narrative of India's energy evolution. Established in 1984, GAIL has been a pivotal player in connecting various dots within the energy supply chain, effectively catering to the diverse energy needs of India. The company operates through an extensive network of pipelines that stretches over 14,000 kilometers, forming the backbone of India's natural gas transmission. This infrastructure not only facilitates the movement of gas for major industries but also aids city gas distribution companies, ensuring that both industrial and residential sectors receive uninterrupted energy supplies. By ensuring the seamless transport of natural gas across vast terrains, GAIL plays a crucial role in integrating regional gas markets and driving the nation's transition towards a cleaner energy mix. Beyond transmission, GAIL's business model is anchored in its diversified operations that span gas processing, petrochemicals, and LPG production and transmission, thereby creating multiple revenue streams. The company's gas processing units extract value-added products while leveraging economies of scale, reinforcing GAIL's role as a formidable entity in gas monetization. Furthermore, its venture into the production of polymers through petrochemical operations adds another layer of value creation. By capitalizing on opportunities in liquefied natural gas (LNG) trading and shipping, GAIL enhances its profitability while maintaining a robust presence in both domestic and international markets. Through strategic investments and alliances, the company continually explores avenues for growth and innovation, solidifying its status as an integral contributor to India's energy sector while striving to balance profitability with sustainability commitments.
See Also
Net Margin is calculated by dividing the Net Income by the Revenue.
The current Net Margin for GAIL (India) Ltd is 6%, which is below its 3-year median of 6.7%.
Over the last 3 years, GAIL (India) Ltd’s Net Margin has decreased from 6% to 6%. During this period, it reached a low of 3% on Jun 30, 2023 and a high of 9% on Dec 31, 2024.
