
Saudi Arabian Mining Company SJSC
SAU:1211

Decide at what price you'd be comfortable buying and we'll help you stay ready.

|
Johnson & Johnson
NYSE:JNJ
|
US |

|
Berkshire Hathaway Inc
NYSE:BRK.A
|
US |

|
Bank of America Corp
NYSE:BAC
|
US |

|
Mastercard Inc
NYSE:MA
|
US |

|
UnitedHealth Group Inc
NYSE:UNH
|
US |

|
Exxon Mobil Corp
NYSE:XOM
|
US |

|
Pfizer Inc
NYSE:PFE
|
US |

|
Nike Inc
NYSE:NKE
|
US |

|
Visa Inc
NYSE:V
|
US |

|
Alibaba Group Holding Ltd
NYSE:BABA
|
CN |

|
JPMorgan Chase & Co
NYSE:JPM
|
US |

|
Coca-Cola Co
NYSE:KO
|
US |

|
Verizon Communications Inc
NYSE:VZ
|
US |

|
Chevron Corp
NYSE:CVX
|
US |

|
Walt Disney Co
NYSE:DIS
|
US |

|
PayPal Holdings Inc
NASDAQ:PYPL
|
US |
EV/EBIT
Enterprise Value to EBIT (EV/EBIT) ratio compares a company`s total enterprise value to its earnings before interest and taxes. It shows how much investors are paying for each dollar of the company`s earnings, including both equity and debt.
Enterprise Value to EBIT (EV/EBIT) ratio compares a company`s total enterprise value to its earnings before interest and taxes. It shows how much investors are paying for each dollar of the company`s earnings, including both equity and debt.
Valuation Scenarios
If EV/EBIT returns to its 3-Year Average (40.5), the stock would be worth ﷼63.65 (57% upside from current price).
| Scenario | EV/EBIT Value | Implied Price | Upside/Downside |
|---|---|---|---|
| Current Multiple | 25.9 | ﷼40.65 |
0%
|
| 3-Year Average | 40.5 | ﷼63.65 |
+57%
|
| 5-Year Average | 38.2 | ﷼60.01 |
+48%
|
| Industry Average | 15.5 | ﷼24.34 |
-40%
|
| Country Average | 19.3 | ﷼30.32 |
-25%
|
Forward EV/EBIT
Today’s price vs future ebit
| Today's Enterprise Value | EBIT | Forward EV/EBIT | ||
|---|---|---|---|---|
|
﷼268.7B
|
/ |
Jan 2026
﷼10.4B
|
= |
|
|
﷼268.7B
|
/ |
Dec 2026
﷼13.4B
|
= |
|
|
﷼268.7B
|
/ |
Dec 2027
﷼13.4B
|
= |
|
|
﷼268.7B
|
/ |
Dec 2028
﷼11.7B
|
= |
|
Forward EV/EBIT shows whether today’s EV/EBIT still looks high or low once future ebit are taken into account.
Peer Comparison
| Market Cap | EV/EBIT | P/E | ||||
|---|---|---|---|---|---|---|
| SA |

|
Saudi Arabian Mining Company SJSC
SAU:1211
|
248.9B SAR | 25.9 | 33.9 | |
| AU |

|
BHP Group Ltd
ASX:BHP
|
284.9B AUD | 9.5 | 19.6 | |
| AU |

|
Rio Tinto Ltd
ASX:RIO
|
278.6B AUD | 11.5 | 19.8 | |
| UK |

|
Rio Tinto PLC
LSE:RIO
|
119.9B GBP | 10.3 | 15.9 | |
| CH |

|
Glencore PLC
LSE:GLEN
|
65.5B GBP | 36.5 | 238.8 | |
| MX |

|
Grupo Mexico SAB de CV
BMV:GMEXICOB
|
1.5T MXN | 10.6 | 18 | |
| CN |

|
CMOC Group Ltd
SSE:603993
|
414.2B CNY | 9.6 | 20.4 | |
| UK |

|
Anglo American PLC
LSE:AAL
|
43.5B GBP | 16.5 | -15.4 | |
| CN |
C
|
China Molybdenum Co Ltd
OTC:CMCLF
|
52.2B USD | 8.3 | 17.7 | |
| ZA |
A
|
African Rainbow Minerals Ltd
JSE:ARI
|
44.4B ZAR | -72.8 | 34.5 | |
| IN |

|
Vedanta Ltd
NSE:VEDL
|
2.9T INR | 10.5 | 19.8 |
Market Distribution
| Min | 1.6 |
| 30th Percentile | 15.3 |
| Median | 19.3 |
| 70th Percentile | 25.8 |
| Max | 2 801.3 |
Other Multiples
Saudi Arabian Mining Company SJSC
Glance View
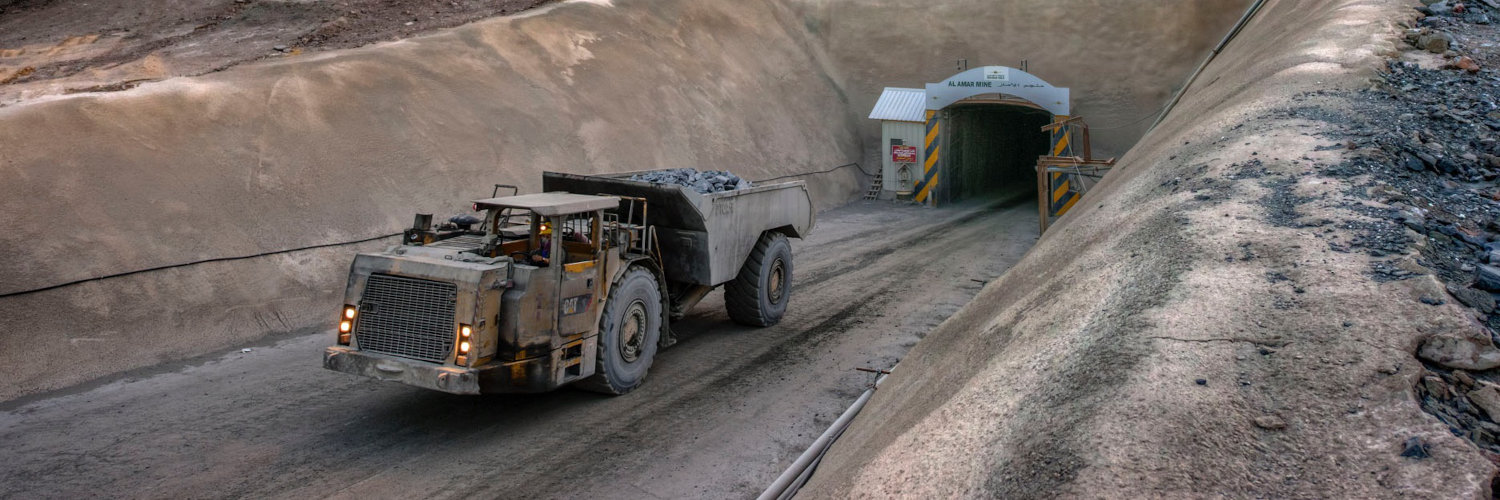
In the heart of the Arabian Peninsula, where the sun-chiseled landscapes tell tales of ancient trade, stands the formidable Saudi Arabian Mining Company, known as Ma'aden. Established in 1997, Ma'aden emerged from the Kingdom's strategic vision to diversify its oil-dependent economy by unlocking the potential of its untapped mineral resources. The company has since embarked on an ambitious journey, mining through the rich veins of gold, phosphate, and aluminum embedded within the desert’s embrace. Its operations span across the value chain—from extraction and processing to production and marketing—each step meticulously orchestrated to maximize value. Combining traditional mining practices with cutting-edge technology, Ma’aden has forged a modern identity in mining, reflecting both sustainability and innovation. Behind Ma'aden's robust financial profile is a complex and astute business model, where resource extraction meets global demand through strategic collaborations and extensive supplier networks. With significant capital invested into expanding infrastructure and refining technological operations, Ma’aden has not only bolstered its production capabilities but also enhanced its cost efficiencies. Its joint ventures with international giants like Alcoa illustrate a strategic alignment to optimize the value of the country's mineral wealth. By leveraging its geographical advantage close to key emerging markets in Asia and Africa, Ma'aden effectively channels its products into lucrative sectors, such as agriculture with its phosphate fertilizers, and automotive and construction with its aluminum. This integration into global supply chains fuels its revenue engine, solidifies its market position, and plays a pivotal role in Saudi Arabia's economic transformation vision.
