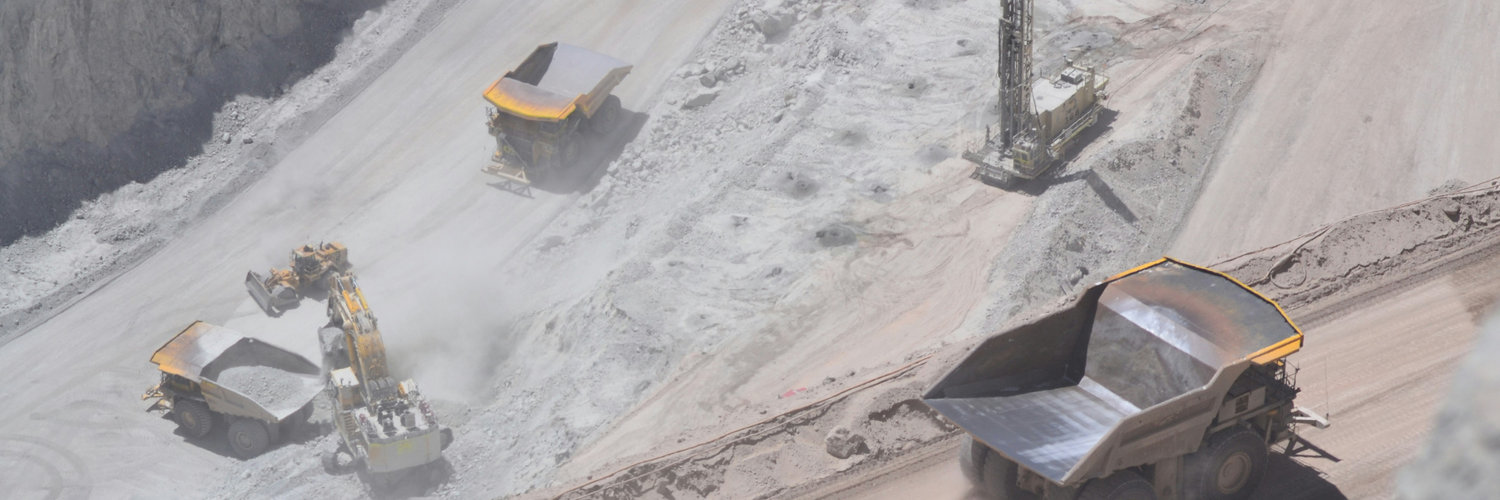

CMOC Group Ltd
SSE:603993

Decide at what price you'd be comfortable buying and we'll help you stay ready.

|
CMOC Group Ltd
SSE:603993
|
CN |
|
R
|
Redelfi SpA
MIL:RDF
|
IT |

|
Kose Corp
TSE:4922
|
JP |
|
F
|
Fenbi Ltd
HKEX:2469
|
CN |
|
P
|
Panafic Industrials Ltd
BSE:538860
|
IN |

|
Shurgard Self Storage Ltd
XBRU:SHUR
|
GG |
|
Gannett Co Inc
NYSE:GCI
|
US |
Profitability Summary
CMOC Group Ltd's profitability score is hidden . We take all the information about a company's profitability (such as its margins, capital efficiency, free cash flow generating ability, and more) and consolidate it into one single number - the profitability score. The higher the profitability score, the more profitable the company is.
Profitability Score
We take all the information about a company's profitability (such as its margins, capital efficiency, free cash flow generating ability, and more) and consolidate it into one single number - the profitability score. The higher the profitability score, the more profitable the company is.
We take all the information about a company's profitability (such as its margins, capital efficiency, free cash flow generating ability, and more) and consolidate it into one single number - the profitability score. The higher the profitability score, the more profitable the company is.
Profitability Score
Margins
Earnings Waterfall
CMOC Group Ltd
Margins Comparison
CMOC Group Ltd Competitors
| Country | Company | Market Cap |
Gross Margin |
Operating Margin |
Net Margin |
||
|---|---|---|---|---|---|---|---|
| CN |
|
CMOC Group Ltd
SSE:603993
|
427.2B CNY |
Loading...
|
Loading...
|
Loading...
|
|
| AU |

|
BHP Group Ltd
ASX:BHP
|
284.9B AUD |
Loading...
|
Loading...
|
Loading...
|
|
| AU |

|
Rio Tinto Ltd
ASX:RIO
|
282.2B AUD |
Loading...
|
Loading...
|
Loading...
|
|
| UK |

|
Rio Tinto PLC
LSE:RIO
|
119.7B GBP |
Loading...
|
Loading...
|
Loading...
|
|
| MX |

|
Grupo Mexico SAB de CV
BMV:GMEXICOB
|
1.6T MXN |
Loading...
|
Loading...
|
Loading...
|
|
| CH |

|
Glencore PLC
LSE:GLEN
|
65.5B GBP |
Loading...
|
Loading...
|
Loading...
|
|
| SA |

|
Saudi Arabian Mining Company SJSC
SAU:1211
|
248.9B SAR |
Loading...
|
Loading...
|
Loading...
|
|
| UK |

|
Anglo American PLC
LSE:AAL
|
42.4B GBP |
Loading...
|
Loading...
|
Loading...
|
|
| CN |
C
|
China Molybdenum Co Ltd
OTC:CMCLF
|
52.4B USD |
Loading...
|
Loading...
|
Loading...
|
|
| ZA |
A
|
African Rainbow Minerals Ltd
JSE:ARI
|
45.9B ZAR |
Loading...
|
Loading...
|
Loading...
|
|
| IN |

|
Vedanta Ltd
NSE:VEDL
|
3T INR |
Loading...
|
Loading...
|
Loading...
|
Return on Capital
Return on Capital Comparison
CMOC Group Ltd Competitors
| Country | Company | Market Cap | ROE | ROA | ROCE | ROIC | ||
|---|---|---|---|---|---|---|---|---|
| CN |
|
CMOC Group Ltd
SSE:603993
|
427.2B CNY |
Loading...
|
Loading...
|
Loading...
|
Loading...
|
|
| AU |
|
BHP Group Ltd
ASX:BHP
|
284.9B AUD |
Loading...
|
Loading...
|
Loading...
|
Loading...
|
|
| AU |
|
Rio Tinto Ltd
ASX:RIO
|
282.2B AUD |
Loading...
|
Loading...
|
Loading...
|
Loading...
|
|
| UK |
|
Rio Tinto PLC
LSE:RIO
|
119.7B GBP |
Loading...
|
Loading...
|
Loading...
|
Loading...
|
|
| MX |
|
Grupo Mexico SAB de CV
BMV:GMEXICOB
|
1.6T MXN |
Loading...
|
Loading...
|
Loading...
|
Loading...
|
|
| CH |
|
Glencore PLC
LSE:GLEN
|
65.5B GBP |
Loading...
|
Loading...
|
Loading...
|
Loading...
|
|
| SA |
|
Saudi Arabian Mining Company SJSC
SAU:1211
|
248.9B SAR |
Loading...
|
Loading...
|
Loading...
|
Loading...
|
|
| UK |
|
Anglo American PLC
LSE:AAL
|
42.4B GBP |
Loading...
|
Loading...
|
Loading...
|
Loading...
|
|
| CN |
C
|
China Molybdenum Co Ltd
OTC:CMCLF
|
52.4B USD |
Loading...
|
Loading...
|
Loading...
|
Loading...
|
|
| ZA |
A
|
African Rainbow Minerals Ltd
JSE:ARI
|
45.9B ZAR |
Loading...
|
Loading...
|
Loading...
|
Loading...
|
|
| IN |
|
Vedanta Ltd
NSE:VEDL
|
3T INR |
Loading...
|
Loading...
|
Loading...
|
Loading...
|
