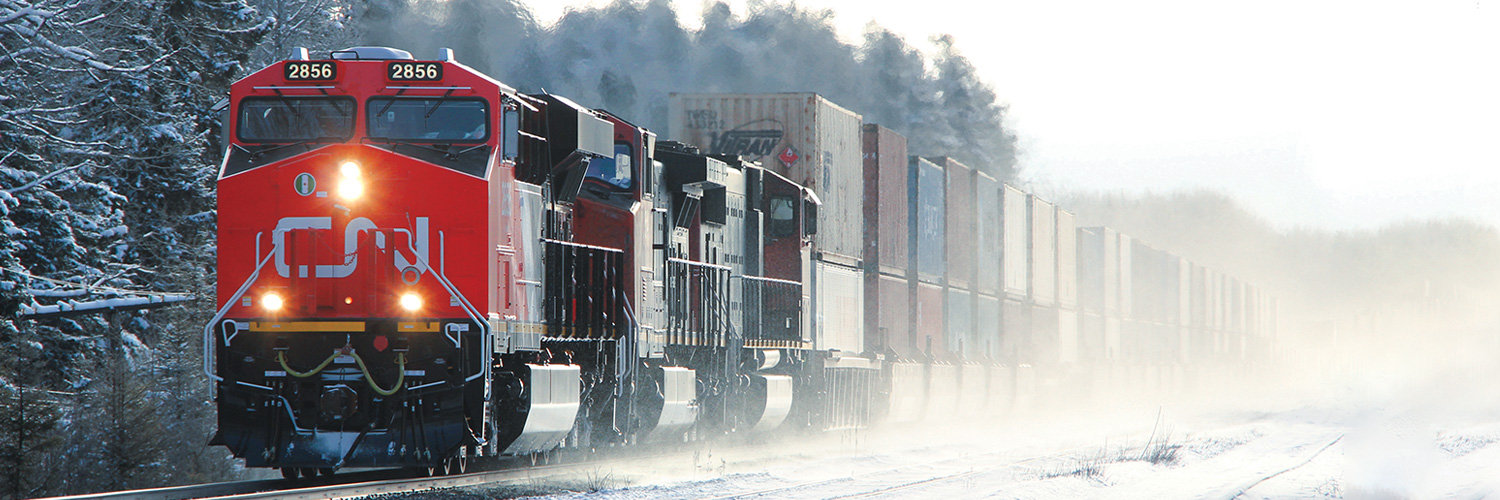

Canadian National Railway Co
TSX:CNR

Decide at what price you'd be comfortable buying and we'll help you stay ready.

|
Canadian National Railway Co
TSX:CNR
|
CA |

|
SATS Ltd
SGX:S58
|
SG |

|
Seadrill Ltd
F:S9AD
|
BM |
|
H
|
Hoang Anh Gia Lai Agricultural JSC
VN:HNG
|
VN |

|
United Parcel Service Inc
NYSE:UPS
|
US |

|
Grupo Aeroportuario del Sureste SAB de CV
BMV:ASURB
|
MX |

|
Circuit Fabology Microelectronics Equipment Co Ltd
SSE:688630
|
CN |
|
M
|
Mediwound Ltd
F:M8W
|
IL |
|
S
|
SGL Carbon SE
LSE:0MPL
|
DE |
Profitability Summary
Canadian National Railway Co's profitability score is Hidden . We take all the information about a company's profitability, such as its margins, capital efficiency, free cash flow generating ability, and more, and consolidate it into one single number: the profitability score. The higher the profitability score, the more profitable the company is.
Profitability Score
We take all the information about a company's profitability, such as its margins, capital efficiency, free cash flow generating ability, and more, and consolidate it into one single number: the profitability score. The higher the profitability score, the more profitable the company is.
We take all the information about a company's profitability, such as its margins, capital efficiency, free cash flow generating ability, and more, and consolidate it into one single number: the profitability score. The higher the profitability score, the more profitable the company is.
Profitability Score
