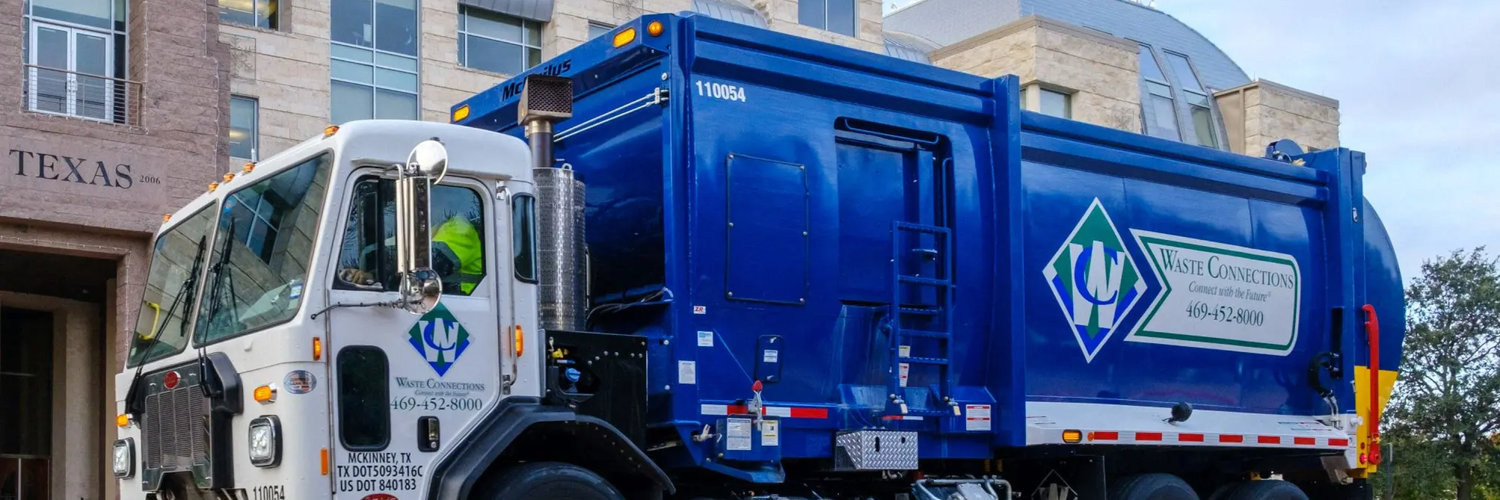
Waste Connections Inc
TSX:WCN

Decide at what price you'd be comfortable buying and we'll help you stay ready.

|
Waste Connections Inc
TSX:WCN
|
CA |
|
H
|
Healthpeak Properties Inc
F:HC5
|
US |

|
Supriya Lifescience Ltd
NSE:SUPRIYA
|
IN |
|
U
|
Unilever PLC
OTC:UNLYF
|
UK |
|
S
|
Star Diamond Corp
OTC:SHGDF
|
CA |

|
People's Insurance Company Group of China Ltd
SSE:601319
|
CN |
|
M
|
Macy's Inc
SWB:FDO
|
US |
|
Alimentation Couche-Tard Inc
F:CJA1
|
CA |

|
Gaotu Techedu Inc
NYSE:GOTU
|
CN |
|
S
|
South Bow Corp
TSX:SOBO
|
CA |
|
T
|
TAG Immobilien AG
SWB:TEG
|
DE |
Profitability Summary
Waste Connections Inc's profitability score is Hidden . We take all the information about a company's profitability, such as its margins, capital efficiency, free cash flow generating ability, and more, and consolidate it into one single number: the profitability score. The higher the profitability score, the more profitable the company is.
Profitability Score
We take all the information about a company's profitability, such as its margins, capital efficiency, free cash flow generating ability, and more, and consolidate it into one single number: the profitability score. The higher the profitability score, the more profitable the company is.
We take all the information about a company's profitability, such as its margins, capital efficiency, free cash flow generating ability, and more, and consolidate it into one single number: the profitability score. The higher the profitability score, the more profitable the company is.
Profitability Score
