Mulberry Group PLC
XBER:MUY

Decide at what price you'd be comfortable buying and we'll help you stay ready.

|
Johnson & Johnson
NYSE:JNJ
|
US |

|
Berkshire Hathaway Inc
NYSE:BRK.A
|
US |

|
Bank of America Corp
NYSE:BAC
|
US |

|
Mastercard Inc
NYSE:MA
|
US |

|
UnitedHealth Group Inc
NYSE:UNH
|
US |

|
Exxon Mobil Corp
NYSE:XOM
|
US |

|
Pfizer Inc
NYSE:PFE
|
US |

|
Nike Inc
NYSE:NKE
|
US |

|
Visa Inc
NYSE:V
|
US |

|
Alibaba Group Holding Ltd
NYSE:BABA
|
CN |

|
JPMorgan Chase & Co
NYSE:JPM
|
US |

|
Coca-Cola Co
NYSE:KO
|
US |

|
Verizon Communications Inc
NYSE:VZ
|
US |

|
Chevron Corp
NYSE:CVX
|
US |

|
Walt Disney Co
NYSE:DIS
|
US |

|
PayPal Holdings Inc
NASDAQ:PYPL
|
US |
P/FCFE
Price to Free Cash Flow to Equity (P/FCFE) ratio compares a company`s market value to the free cash flow available to its shareholders. It`s similar to the P/OCF ratio but more precise, since it accounts for capital expenditures deducted from operating cash flow.
Price to Free Cash Flow to Equity (P/FCFE) ratio compares a company`s market value to the free cash flow available to its shareholders. It`s similar to the P/OCF ratio but more precise, since it accounts for capital expenditures deducted from operating cash flow.
Valuation Scenarios
If P/FCFE returns to its Industry Average (0.9), the stock would be worth €-0.19 (117% downside from current price).
| Scenario | P/FCFE Value | Implied Price | Upside/Downside |
|---|---|---|---|
| Current Multiple | -5.4 | €1.17 |
0%
|
| Industry Average | 0.9 | €-0.19 |
-117%
|
| Country Average | 0.2 | €-0.04 |
-104%
|
Forward P/FCFE
Today’s price vs future free cash flow to equity
Peer Comparison
| Market Cap | P/FCFE | P/E | ||||
|---|---|---|---|---|---|---|
| UK |

|
Mulberry Group PLC
XBER:MUY
|
81.2m EUR | -5.4 | -3.7 | |
| FR |

|
LVMH Moet Hennessy Louis Vuitton SE
PAR:MC
|
224.1B EUR | 26.3 | 20.6 | |
| FR |

|
Hermes International SCA
PAR:RMS
|
170.2B EUR | 43.9 | 37.6 | |
| KR |

|
SBW
KRX:102280
|
235.5T KRW | -64 791.4 | -117 637.1 | |
| CH |

|
Compagnie Financiere Richemont SA
SIX:CFR
|
87.3B CHF | 35.6 | 23.5 | |
| FR |

|
EssilorLuxottica SA
PAR:EL
|
84B EUR | 22.1 | 36.3 | |
| FR |

|
Christian Dior SE
PAR:CDI
|
76.7B EUR | 8.8 | 16.9 | |
| IN |

|
Titan Company Ltd
NSE:TITAN
|
3.9T INR | 464.9 | 81.6 | |
| FR |

|
Kering SA
PAR:KER
|
28.5B EUR | 147.6 | 396.2 | |
| DE |

|
Adidas AG
XETRA:ADS
|
26.3B EUR | -71.1 | 19.7 | |
| US |

|
Tapestry Inc
NYSE:TPR
|
28.9B USD | 24.6 | 55.4 |
Market Distribution
| Min | 0 |
| 30th Percentile | 0.1 |
| Median | 0.2 |
| 70th Percentile | 0.4 |
| Max | 901.8 |
Other Multiples
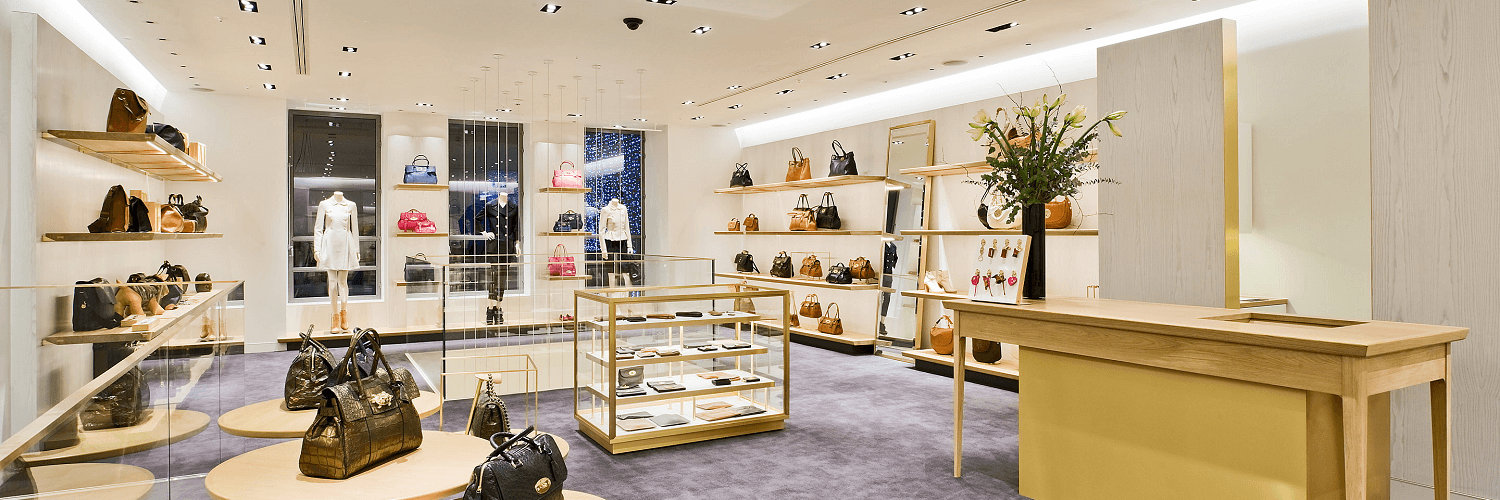
Mulberry Group PLC
Glance View
Mulberry Group Plc engages in the design and manufacture of luxury accessories, clothing, and footwear. The company is headquartered in Bath, Somerset and currently employs 998 full-time employees. The firm designs, manufactures and manages the Mulberry brand. Its product categories include leather goods, shoes, soft accessories and women ready-to-wear. Its services include delivery, care and repairs, gift wrapping, gifts, virtual appointments and Mulberry exchange. The firm sells directly to consumers around 190 countries through its integrated digital channels and store network. In other territories, the Company work with selected local partners to deliver its products. The firm has distribution centers in the United Kingdom, Europe, North America and Asia. Its subsidiaries include Mulberry Company (Design) Limited, Mulberry Company (France) SARL, Mulberry Company (Sales) Limited, Mulberry Company (Europe) Limited, Mulberry Group Holding Company Limited and Mulberry Trading Holding Company Limited, among others.
