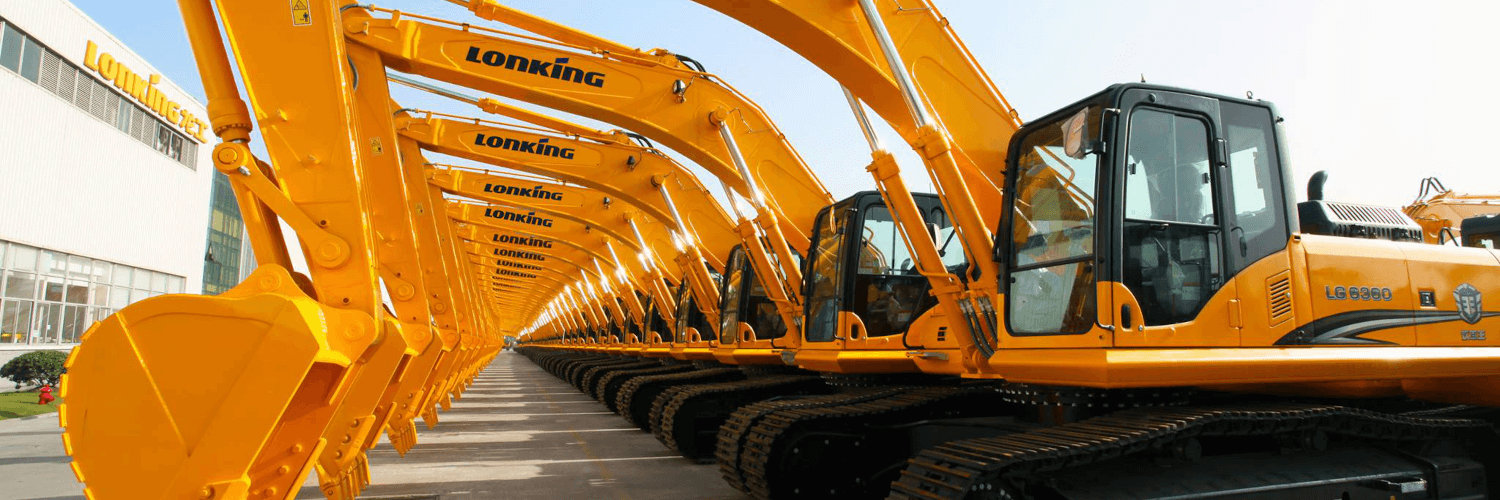

Lonking Holdings Ltd
HKEX:3339

Decide at what price you'd be comfortable buying and we'll help you stay ready.

|
Lonking Holdings Ltd
HKEX:3339
|
CN |

|
Severstal' PAO
OTC:SVJTY
|
RU |
|
S
|
Schneider Electric SE
XHAM:SND
|
FR |

|
Jyske Bank A/S
CSE:JYSK
|
DK |

|
Zip Co Ltd
F:YRRA
|
AU |
|
T
|
Trex Company Inc
F:TRR
|
US |
Profitability Summary
Lonking Holdings Ltd's profitability score is Hidden . We take all the information about a company's profitability, such as its margins, capital efficiency, free cash flow generating ability, and more, and consolidate it into one single number: the profitability score. The higher the profitability score, the more profitable the company is.
Profitability Score
We take all the information about a company's profitability, such as its margins, capital efficiency, free cash flow generating ability, and more, and consolidate it into one single number: the profitability score. The higher the profitability score, the more profitable the company is.
We take all the information about a company's profitability, such as its margins, capital efficiency, free cash flow generating ability, and more, and consolidate it into one single number: the profitability score. The higher the profitability score, the more profitable the company is.
Profitability Score
