
Fuelcell Energy Inc
NASDAQ:FCEL

Decide at what price you'd be comfortable buying and we'll help you stay ready.

|
Johnson & Johnson
NYSE:JNJ
|
US |

|
Berkshire Hathaway Inc
NYSE:BRK.A
|
US |

|
Bank of America Corp
NYSE:BAC
|
US |

|
Mastercard Inc
NYSE:MA
|
US |

|
UnitedHealth Group Inc
NYSE:UNH
|
US |

|
Exxon Mobil Corp
NYSE:XOM
|
US |

|
Pfizer Inc
NYSE:PFE
|
US |

|
Nike Inc
NYSE:NKE
|
US |

|
Visa Inc
NYSE:V
|
US |

|
Alibaba Group Holding Ltd
NYSE:BABA
|
CN |

|
JPMorgan Chase & Co
NYSE:JPM
|
US |

|
Coca-Cola Co
NYSE:KO
|
US |

|
Verizon Communications Inc
NYSE:VZ
|
US |

|
Chevron Corp
NYSE:CVX
|
US |

|
Walt Disney Co
NYSE:DIS
|
US |

|
PayPal Holdings Inc
NASDAQ:PYPL
|
US |
P/S
Price to Sales (P/S) ratio shows how much investors pay for each dollar of a company`s sales. It`s calculated by dividing the company`s market value by its total revenue.
Price to Sales (P/S) ratio shows how much investors pay for each dollar of a company`s sales. It`s calculated by dividing the company`s market value by its total revenue.
Valuation Scenarios
If P/S returns to its 3-Year Average (2.6), the stock would be worth $8.39 (22% downside from current price).
| Scenario | P/S Value | Implied Price | Upside/Downside |
|---|---|---|---|
| Current Multiple | 3.3 | $10.72 |
0%
|
| 3-Year Average | 2.6 | $8.39 |
-22%
|
| 5-Year Average | 144.6 | $466.93 |
+4 256%
|
| Industry Average | 2.5 | $8 |
-25%
|
| Country Average | 2.4 | $7.86 |
-27%
|
Forward P/S
Today’s price vs future revenue
| Today's Market Cap | Revenue | Forward P/S | ||
|---|---|---|---|---|
|
$350.6m
|
/ |
Feb 2026
$169.7m
|
= |
|
|
$350.6m
|
/ |
Oct 2026
$165.7m
|
= |
|
|
$350.6m
|
/ |
Oct 2027
$236.1m
|
= |
|
|
$350.6m
|
/ |
Oct 2028
$366m
|
= |
|
|
$350.6m
|
/ |
Oct 2029
$504.7m
|
= |
|
|
$350.6m
|
/ |
Oct 2030
$608m
|
= |
|
|
$350.6m
|
/ |
Oct 2031
$442.7m
|
= |
|
Forward P/S shows whether today’s P/S still looks high or low once future revenue are taken into account.
Peer Comparison
| Market Cap | P/S | P/E | ||||
|---|---|---|---|---|---|---|
| US |

|
Fuelcell Energy Inc
NASDAQ:FCEL
|
587.6m USD | 3.3 | -3 | |
| CN |

|
Contemporary Amperex Technology Co Ltd
SZSE:300750
|
2T CNY | 4.3 | 25.7 | |
| FR |

|
Schneider Electric SE
PAR:SU
|
155B EUR | 3.9 | 37.2 | |
| CH |

|
Abb Ltd
SIX:ABBN
|
141.4B CHF | 5.3 | 36.2 | |
| IE |

|
Eaton Corporation PLC
NYSE:ETN
|
164.4B USD | 5.9 | 39.5 | |
| US |

|
Vertiv Holdings Co
NYSE:VRT
|
124.2B USD | 11.4 | 79.4 | |
| US |

|
Emerson Electric Co
NYSE:EMR
|
79.4B USD | 4.4 | 34.3 | |
| KR |

|
LG Energy Solution Ltd
KRX:373220
|
112.6T KRW | 4.8 | -104.9 | |
| JP |

|
Fujikura Ltd
TSE:5803
|
10.5T JPY | 9.4 | 73 | |
| US |

|
AMETEK Inc
NYSE:AME
|
53.4B USD | 7.2 | 36.1 | |
| FR |

|
Legrand SA
PAR:LR
|
39.3B EUR | 4.2 | 31.6 |
Market Distribution
| Min | 0 |
| 30th Percentile | 1.2 |
| Median | 2.4 |
| 70th Percentile | 4.1 |
| Max | 4 613 274.2 |
Other Multiples
Fuelcell Energy Inc
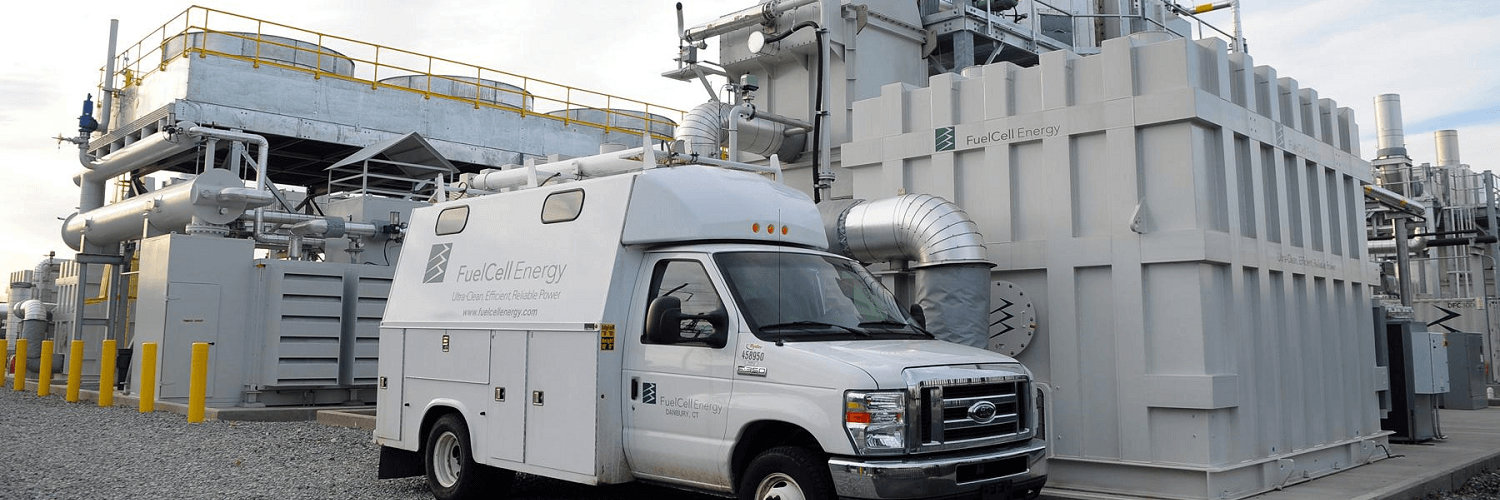
Glance View
FuelCell Energy, Inc. engages in the development, design, production, construction and servicing of high temperature fuel cells for clean electric power generation. The company is headquartered in Danbury, Connecticut and currently employs 382 full-time employees. The firm serves customers worldwide with sustainable products and solutions for businesses, utilities, governments and municipalities. The firm offers sub-megawatt solutions for smaller power consumers in Europe. Its customer base includes utility companies, municipalities, universities, hospitals, government entities/military bases and a variety of industrial and commercial enterprises. Projects for utility companies are known as front of the meter (FTM) and projects for all non-utility customers are known as behind the meter (BTM). The company operates in various markets, including the United States and South Korea. Its multi-featured platforms can be configured to provide a number of value streams, including electricity, usable heat, water and hydrogen, and to concentrate and separate CO2 from industrial applications using fossil fuels.
