Cameco Corp
NYSE:CCJ

Decide at what price you'd be comfortable buying and we'll help you stay ready.

|
Johnson & Johnson
NYSE:JNJ
|
US |

|
Berkshire Hathaway Inc
NYSE:BRK.A
|
US |

|
Bank of America Corp
NYSE:BAC
|
US |

|
Mastercard Inc
NYSE:MA
|
US |

|
UnitedHealth Group Inc
NYSE:UNH
|
US |

|
Exxon Mobil Corp
NYSE:XOM
|
US |

|
Pfizer Inc
NYSE:PFE
|
US |

|
Nike Inc
NYSE:NKE
|
US |

|
Visa Inc
NYSE:V
|
US |

|
Alibaba Group Holding Ltd
NYSE:BABA
|
CN |

|
JPMorgan Chase & Co
NYSE:JPM
|
US |

|
Coca-Cola Co
NYSE:KO
|
US |

|
Verizon Communications Inc
NYSE:VZ
|
US |

|
Chevron Corp
NYSE:CVX
|
US |

|
Walt Disney Co
NYSE:DIS
|
US |

|
PayPal Holdings Inc
NASDAQ:PYPL
|
US |
EV/EBITDA
Enterprise Value to EBITDA (EV/EBITDA) ratio compares a company`s total enterprise value to its earnings before interest, taxes, depreciation, and amortization. It shows how much investors are paying for each dollar of the company`s earnings, including both equity and debt.
Enterprise Value to EBITDA (EV/EBITDA) ratio compares a company`s total enterprise value to its earnings before interest, taxes, depreciation, and amortization. It shows how much investors are paying for each dollar of the company`s earnings, including both equity and debt.
Valuation Scenarios
If EV/EBITDA returns to its 3-Year Average (53.3), the stock would be worth $82.63 (32% downside from current price).
| Scenario | EV/EBITDA Value | Implied Price | Upside/Downside |
|---|---|---|---|
| Current Multiple | 78.1 | $120.97 |
0%
|
| 3-Year Average | 53.3 | $82.63 |
-32%
|
| 5-Year Average | 58.4 | $90.53 |
-25%
|
| Industry Average | 6.2 | $9.56 |
-92%
|
| Country Average | 10.2 | $15.76 |
-87%
|
Forward EV/EBITDA
Today’s price vs future ebitda
| Today's Enterprise Value | EBITDA | Forward EV/EBITDA | ||
|---|---|---|---|---|
|
$51.3B
|
/ |
Jan 2026
CA$914.4m
|
= |
|
|
$51.3B
|
/ |
Dec 2026
CA$1.9B
|
= |
|
|
$51.3B
|
/ |
Dec 2027
CA$2.4B
|
= |
|
|
$51.3B
|
/ |
Dec 2028
CA$2.6B
|
= |
|
Forward EV/EBITDA shows whether today’s EV/EBITDA still looks high or low once future ebitda are taken into account.
Peer Comparison
| Market Cap | EV/EBITDA | P/E | ||||
|---|---|---|---|---|---|---|
| CA |
C
|
Cameco Corp
NYSE:CCJ
|
50.8B USD | 78.1 | 121.5 | |
| ID |

|
Alamtri Resources Indonesia Tbk PT
F:A640
|
159.8B EUR | 351.5 | 413.3 | |
| CN |

|
China Shenhua Energy Co Ltd
SSE:601088
|
913.6B CNY | 13.3 | 17.2 | |
| ZA |
E
|
Exxaro Resources Ltd
JSE:EXX
|
71.4B ZAR | 5.7 | 9.4 | |
| CN |

|
Shaanxi Coal Industry Co Ltd
SSE:601225
|
247.2B CNY | 7.2 | 10.8 | |
| CN |

|
China Coal Energy Co Ltd
SSE:601898
|
220B CNY | 8.9 | 12.3 | |
| IN |

|
Coal India Ltd
NSE:COALINDIA
|
2.7T INR | 6 | 9.2 | |
| CN |

|
Yankuang Energy Group Co Ltd
SSE:600188
|
195.2B CNY | 15.1 | 23.3 | |
| ID |

|
Dian Swastatika Sentosa Tbk PT
IDX:DSSA
|
481.6T IDR | 75 | 116.2 | |
| ID |

|
Bayan Resources Tbk PT
IDX:BYAN
|
412.5T IDR | 23.8 | 32.1 | |
| ZA |
T
|
Thungela Resources Ltd
JSE:TGA
|
19B ZAR | 9.3 | -2.7 |
Market Distribution
| Min | 0 |
| 30th Percentile | 7 |
| Median | 10.2 |
| 70th Percentile | 14.5 |
| Max | 13 731.1 |
Other Multiples
Cameco Corp
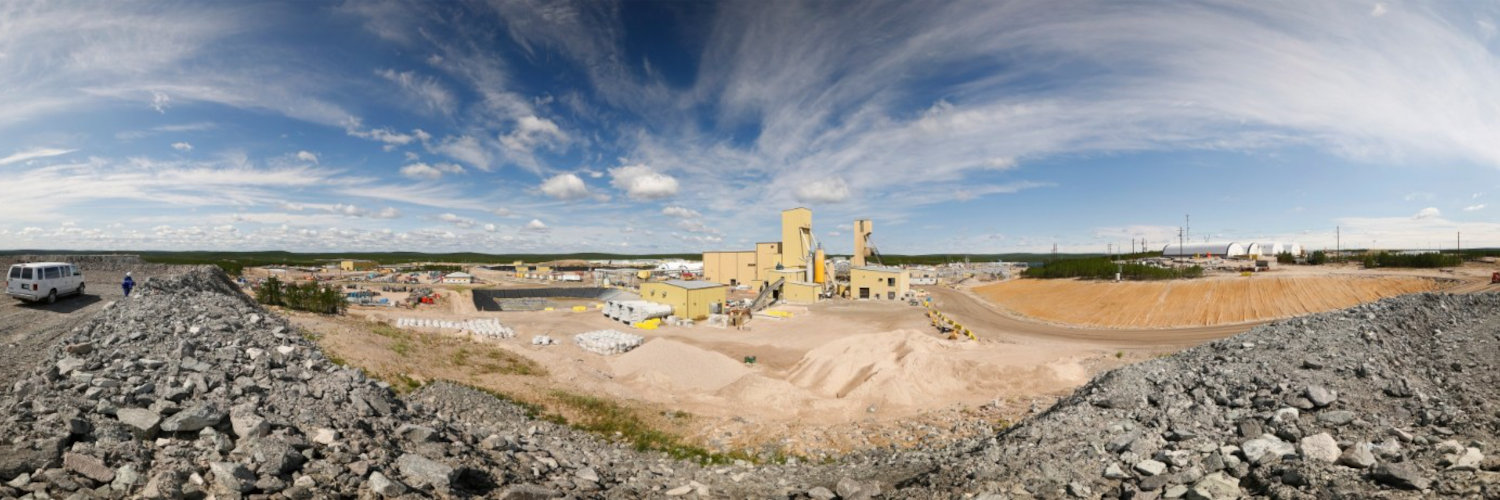
Glance View
In the northern expanses of Canada, amid vast landscapes that hide treasures beneath their surface, Cameco Corp. stands as a beacon in the uranium industry. Since its inception in 1988, the company has evolved into one of the world's largest uranium producers, playing a crucial role in the global energy landscape. Cameco's operations are centered around mining and refining uranium ore, primarily in its lucrative Canadian mines like Cigar Lake and McArthur River, both renowned for their rich deposits. Beyond merely extracting this vital resource, Cameco also processes the ore into a more refined product ready for use in nuclear reactors. Cameco monetizes its operations by selling this refined uranium, known as uranium concentrate, to nuclear power plants around the world. These power plants rely on Cameco's products to fuel reactors that generate electricity, underpinning the significant demand for uranium. Additionally, Cameco engages in uranium trading, adding an extra stream of revenue through these auxiliary market activities. Furthermore, the company provides nuclear fuel services ranging from conversion to advanced fuel cycle management. Balancing these complementary activities, Cameco navigates the often complex regulatory and geopolitical issues inherent in the nuclear energy industry, sustaining its position as a key player in the global energy supply chain.
