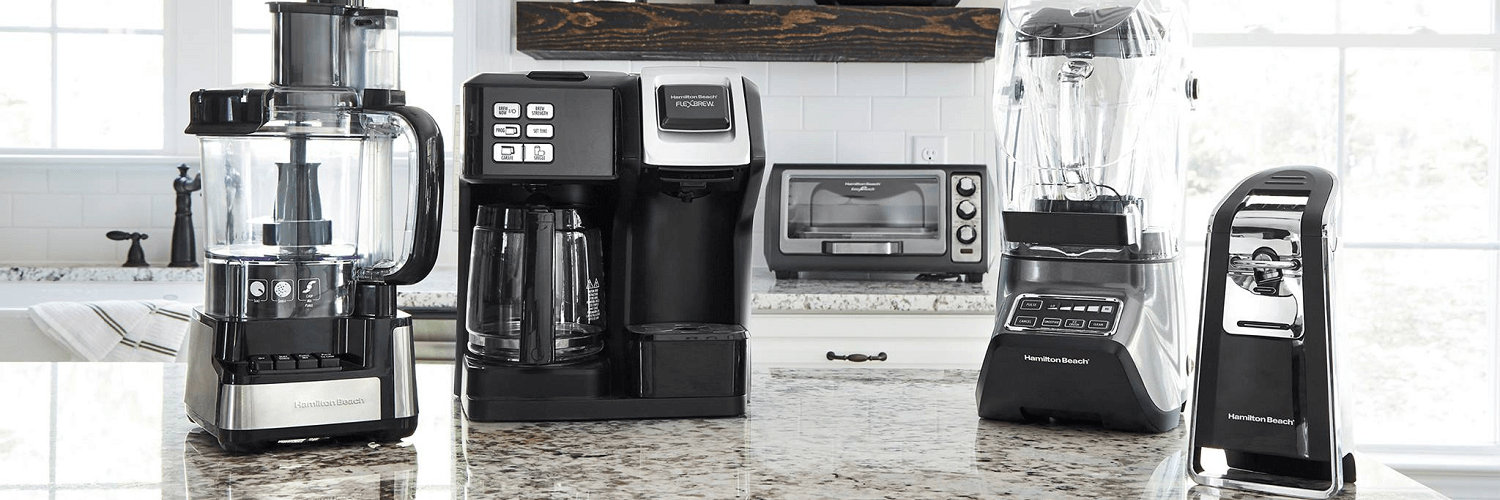
Hamilton Beach Brands Holding Co
NYSE:HBB

Decide at what price you'd be comfortable buying and we'll help you stay ready.
|
Hamilton Beach Brands Holding Co
NYSE:HBB
|
US |

|
Acasti Pharma Inc
XTSX:ACST
|
CA |

|
Rocky Mountain Chocolate Factory Inc (Delaware)
NASDAQ:RMCF
|
US |

|
Intrasoft Technologies Ltd
NSE:ISFT
|
IN |

|
Telecom Egypt Co SAE
LSE:TEEG
|
EG |
|
Shoprite Holdings Ltd
OTC:SRGHY
|
ZA |

|
Arizona Lithium Ltd
ASX:AZL
|
AU |
Profitability Summary
Hamilton Beach Brands Holding Co's profitability score is Hidden . We take all the information about a company's profitability, such as its margins, capital efficiency, free cash flow generating ability, and more, and consolidate it into one single number: the profitability score. The higher the profitability score, the more profitable the company is.
Profitability Score
We take all the information about a company's profitability, such as its margins, capital efficiency, free cash flow generating ability, and more, and consolidate it into one single number: the profitability score. The higher the profitability score, the more profitable the company is.
We take all the information about a company's profitability, such as its margins, capital efficiency, free cash flow generating ability, and more, and consolidate it into one single number: the profitability score. The higher the profitability score, the more profitable the company is.
Profitability Score
