
Transocean Ltd
NYSE:RIG

Decide at what price you'd be comfortable buying and we'll help you stay ready.

|
Johnson & Johnson
NYSE:JNJ
|
US |

|
Berkshire Hathaway Inc
NYSE:BRK.A
|
US |

|
Bank of America Corp
NYSE:BAC
|
US |

|
Mastercard Inc
NYSE:MA
|
US |

|
UnitedHealth Group Inc
NYSE:UNH
|
US |

|
Exxon Mobil Corp
NYSE:XOM
|
US |

|
Pfizer Inc
NYSE:PFE
|
US |

|
Nike Inc
NYSE:NKE
|
US |

|
Visa Inc
NYSE:V
|
US |

|
Alibaba Group Holding Ltd
NYSE:BABA
|
CN |

|
JPMorgan Chase & Co
NYSE:JPM
|
US |

|
Coca-Cola Co
NYSE:KO
|
US |

|
Verizon Communications Inc
NYSE:VZ
|
US |

|
Chevron Corp
NYSE:CVX
|
US |

|
Walt Disney Co
NYSE:DIS
|
US |

|
PayPal Holdings Inc
NASDAQ:PYPL
|
US |
P/FCFE
Price to Free Cash Flow to Equity (P/FCFE) ratio compares a company`s market value to the free cash flow available to its shareholders. It`s similar to the P/OCF ratio but more precise, since it accounts for capital expenditures deducted from operating cash flow.
Price to Free Cash Flow to Equity (P/FCFE) ratio compares a company`s market value to the free cash flow available to its shareholders. It`s similar to the P/OCF ratio but more precise, since it accounts for capital expenditures deducted from operating cash flow.
Valuation Scenarios
If P/FCFE returns to its Industry Average (931.4), the stock would be worth $-818.22 (12 062% downside from current price).
| Scenario | P/FCFE Value | Implied Price | Upside/Downside |
|---|---|---|---|
| Current Multiple | -7.8 | $6.84 |
0%
|
| Industry Average | 931.4 | $-818.22 |
-12 062%
|
| Country Average | 20.4 | $-17.91 |
-362%
|
Forward P/FCFE
Today’s price vs future free cash flow to equity
Peer Comparison
| Market Cap | P/FCFE | P/E | ||||
|---|---|---|---|---|---|---|
| CH |

|
Transocean Ltd
NYSE:RIG
|
7.5B USD | -7.8 | -2.6 | |
| CN |

|
China Oilfield Services Ltd
SSE:601808
|
72.1B CNY | 12.7 | 18.9 | |
| US |

|
Noble Corp (Cayman Island)
NYSE:NE
|
8B USD | 28.7 | 37 | |
| BM |

|
Valaris Ltd
NYSE:VAL
|
7.1B USD | 167.4 | 7.2 | |
| SA |
A
|
ADES Holding Company SJSC
SAU:2382
|
21.9B SAR | 5.5 | 26.8 | |
| US |

|
Noble Corporation PLC
CSE:NOBLE
|
31.4B DKK | 17.6 | 22.7 | |
| US |

|
Patterson-UTI Energy Inc
NASDAQ:PTEN
|
4.5B USD | 15.5 | -48.6 | |
| US |

|
Helmerich and Payne Inc
NYSE:HP
|
4B USD | 19.1 | -12.7 | |
| BM |

|
Seadrill Ltd
NYSE:SDRL
|
3.1B USD | -14.1 | -39.9 | |
| SA |
A
|
Arabian Drilling Co
SAU:2381
|
10.8B SAR | -460.3 | -143.1 | |
| BM |

|
Odfjell Drilling Ltd
OSE:ODL
|
23.8B NOK | 27.4 | 15.5 |
Market Distribution
| Min | 0.1 |
| 30th Percentile | 13.4 |
| Median | 20.4 |
| 70th Percentile | 31.1 |
| Max | 931.4 |
Other Multiples
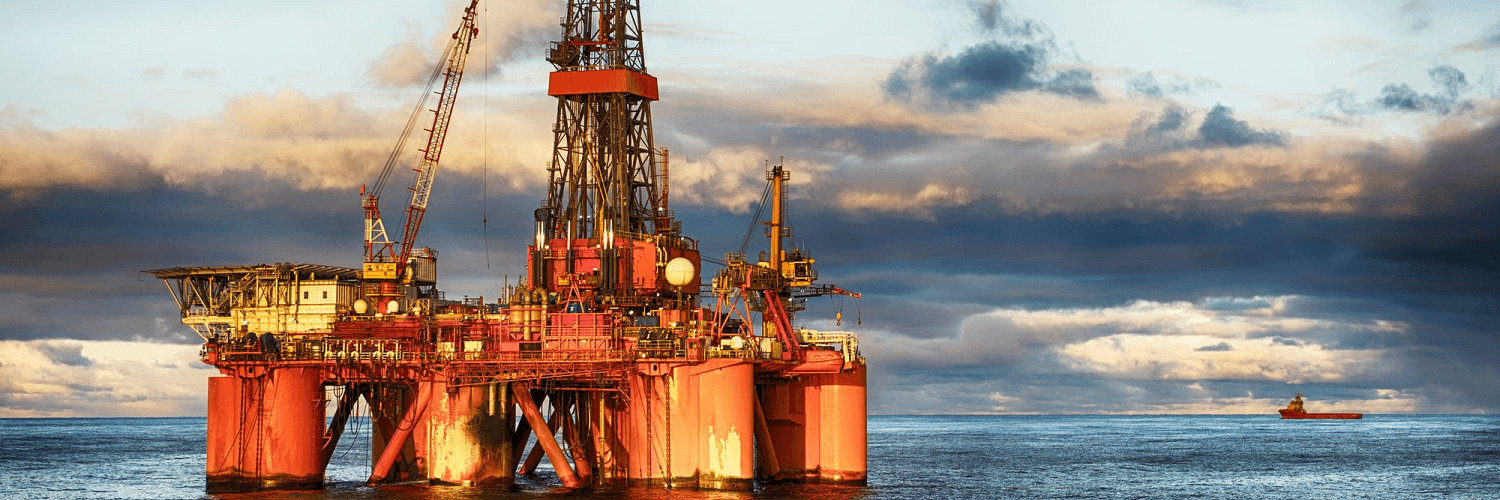
Transocean Ltd
Glance View
In the vast expanse of the offshore drilling industry, Transocean Ltd. stands as a formidable player, navigating the high seas of oil and gas exploration with a legacy rooted in deep-water expertise. Founded in 1953, the company has evolved to become a giant in the drilling sector, strategically positioning itself across the globe’s most promising basins. Transocean thrives by providing comprehensive offshore contract drilling services, primarily through its fleet of ultra-deepwater and harsh-environment rigs. This fleet, often referred to as the crown jewels of the company, enables oil and gas majors to tap into the underwater reservoirs lying beneath the ocean's floor. By leasing these sophisticated rigs and providing crews to operate them, Transocean generates a substantial portion of its revenue, capitalizing on the fluctuating demand for energy and commodities. Revenue streams flow robustly from long-term contracts secured with major oil companies, allowing Transocean to promise shareholders a degree of stability amid the cyclical nature of the energy sector. The company’s ability to command premium day rates for its state-of-the-art rigs is a testament to its commitment to technological innovation and operational excellence. By focusing on efficiency and safety, Transocean not only ensures the effectiveness of its drilling operations but also fortifies its reputation in an industry where mishaps can lead to significant setbacks. In essence, Transocean operates as both a key enabler and a steadfast partner in the quest for hydrocarbon exploration and production, its fortunes interlinked with the broader swings of the global energy market.
