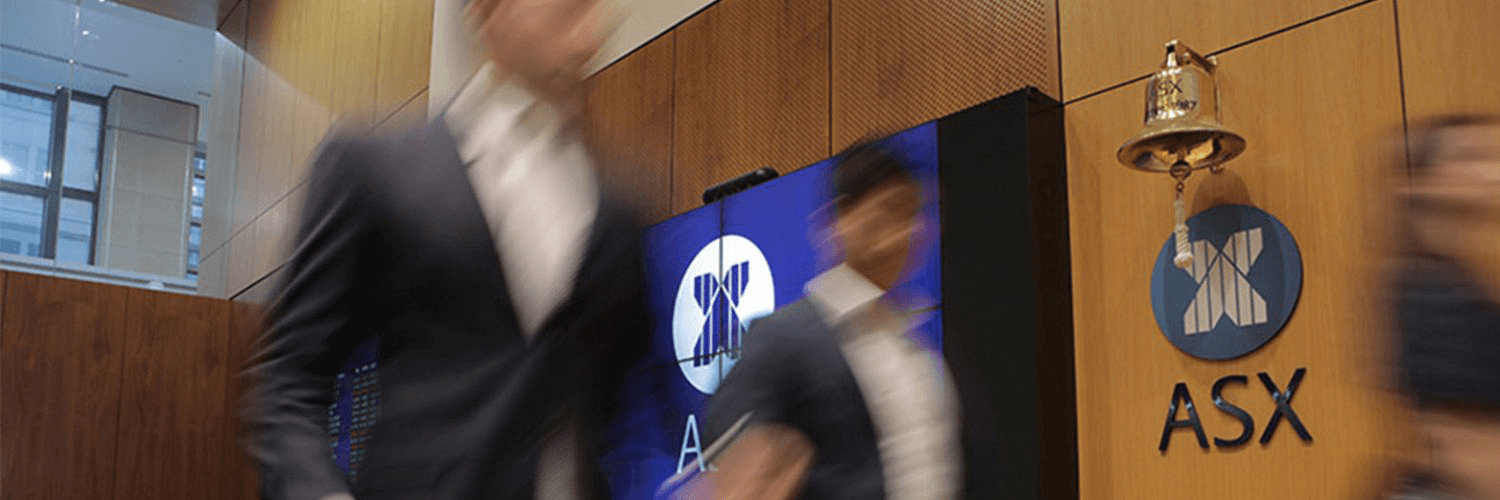
ASX Ltd
OTC:ASXFY

Decide at what price you'd be comfortable buying and we'll help you stay ready.
|
S
|
Sterling Construction Company Inc
F:UAO
|
US |
|
I
|
Infrastructure Materials Corp
OTC:IFAM
|
US |
Operating Margin
Operating Margin shows how much profit a company makes from its regular business activities after covering operating costs. It helps measure how efficiently the company turns sales into profit.
Operating Margin shows how much profit a company makes from its regular business activities after covering operating costs. It helps measure how efficiently the company turns sales into profit.
Peer Comparison
| Country | Company | Market Cap |
Operating Margin |
||
|---|---|---|---|---|---|
| AU |
|
ASX Ltd
ASX:ASX
|
11.2B AUD |
Loading...
|
|
| US |

|
S&P Global Inc
NYSE:SPGI
|
129.8B USD |
Loading...
|
|
| US |

|
CME Group Inc
NASDAQ:CME
|
107.8B USD |
Loading...
|
|
| US |

|
Intercontinental Exchange Inc
NYSE:ICE
|
91.8B USD |
Loading...
|
|
| US |

|
Moody's Corp
NYSE:MCO
|
77.8B USD |
Loading...
|
|
| HK |

|
Hong Kong Exchanges and Clearing Ltd
HKEX:388
|
517.5B HKD |
Loading...
|
|
| UK |

|
London Stock Exchange Group PLC
LSE:LSEG
|
45.8B GBP |
Loading...
|
|
| DE |

|
Deutsche Boerse AG
XETRA:DB1
|
46B EUR |
Loading...
|
|
| US |

|
Nasdaq Inc
NASDAQ:NDAQ
|
48B USD |
Loading...
|
|
| US |

|
Coinbase Global Inc
NASDAQ:COIN
|
45.3B USD |
Loading...
|
|
| CN |

|
East Money Information Co Ltd
SZSE:300059
|
299.5B CNY |
Loading...
|
Market Distribution
| Min | -14 949 200% |
| 30th Percentile | -526.4% |
| Median | -25.2% |
| 70th Percentile | 6.1% |
| Max | 145 596.9% |
Other Profitability Ratios
ASX Ltd
Glance View
ASX Ltd., headquartered in Sydney, is the beating heart of Australia's financial markets. Established through the amalgamation of six independent state-based stock exchanges, it has grown into a pivotal player in the financial sector. At its core, ASX Ltd. operates the Australian Securities Exchange, which serves as a critical platform for equity trading, derivatives, fixed income securities, and more. The company’s robust infrastructure provides the essential services of clearing, settlement, and managing risk across diverse financial products. It acts as a marketplace that brings together buyers and sellers, facilitating transactions that drive capital flow and investment opportunities throughout the Australian and international economy. Digging deeper into ASX's revenue streams, it's apparent that a significant portion emanates from listing fees and trading services. Companies across Australia and beyond covet a spot on the ASX, drawn by its international reputation and access to a vast pool of potential investors. This desire translates into lucrative listing fees for the exchange. In parallel, every transaction in its markets attracts fees, whether from stock trades, derivatives transactions, or other financial products. Additionally, ASX generates income by providing data and technology services, offering market participants critical insights and tools. By perpetuating market efficiency and transparency, ASX Ltd. ensures its pivotal role within the financial ecosystem, turning infrastructure prowess into profitable endeavors.
See Also
Operating Margin is calculated by dividing the Operating Income by the Revenue.
The current Operating Margin for ASX Ltd is 56.6%, which is below its 3-year median of 59.2%.
Over the last 3 years, ASX Ltd’s Operating Margin has decreased from 66.1% to 56.6%. During this period, it reached a low of 56.6% on Jan 1, 2026 and a high of 66.1% on Dec 31, 2022.
