
Endesa SA
OTC:ELEZY

Decide at what price you'd be comfortable buying and we'll help you stay ready.

|
Johnson & Johnson
NYSE:JNJ
|
US |

|
Berkshire Hathaway Inc
NYSE:BRK.A
|
US |

|
Bank of America Corp
NYSE:BAC
|
US |

|
Mastercard Inc
NYSE:MA
|
US |

|
UnitedHealth Group Inc
NYSE:UNH
|
US |

|
Exxon Mobil Corp
NYSE:XOM
|
US |

|
Pfizer Inc
NYSE:PFE
|
US |

|
Nike Inc
NYSE:NKE
|
US |

|
Visa Inc
NYSE:V
|
US |

|
Alibaba Group Holding Ltd
NYSE:BABA
|
CN |

|
JPMorgan Chase & Co
NYSE:JPM
|
US |

|
Coca-Cola Co
NYSE:KO
|
US |

|
Verizon Communications Inc
NYSE:VZ
|
US |

|
Chevron Corp
NYSE:CVX
|
US |

|
Walt Disney Co
NYSE:DIS
|
US |

|
PayPal Holdings Inc
NASDAQ:PYPL
|
US |
P/E
Price to Earnings (P/E) ratio shows how much investors pay for each dollar of a company`s earnings. It`s calculated by dividing the company`s market value by its total earnings.
Price to Earnings (P/E) ratio shows how much investors pay for each dollar of a company`s earnings. It`s calculated by dividing the company`s market value by its total earnings.
Valuation Scenarios
If P/E returns to its 3-Year Average (9.5), the stock would be worth $12.09 (47% downside from current price).
| Scenario | P/E Value | Implied Price | Upside/Downside |
|---|---|---|---|
| Current Multiple | 17.7 | $22.61 |
0%
|
| 3-Year Average | 9.5 | $12.09 |
-47%
|
| 5-Year Average | 12.5 | $15.98 |
-29%
|
| Industry Average | 12.6 | $16.07 |
-29%
|
| Country Average | 13.8 | $17.55 |
-22%
|
Forward P/E
Today’s price vs future net income
| Today's Market Cap | Net Income | Forward P/E | ||
|---|---|---|---|---|
|
$36.3B
|
/ |
Jan 2026
€2.2B
|
= |
|
|
$36.3B
|
/ |
Dec 2026
€2.4B
|
= |
|
|
$36.3B
|
/ |
Dec 2027
€2.4B
|
= |
|
|
$36.3B
|
/ |
Dec 2028
€2.5B
|
= |
|
|
$36.3B
|
/ |
Dec 2029
€2.5B
|
= |
|
|
$36.3B
|
/ |
Dec 2030
€2.5B
|
= |
|
Forward P/E shows whether today’s P/E still looks high or low once future net income are taken into account.
Peer Comparison
| Market Cap | P/E | ||||
|---|---|---|---|---|---|
| ES |

|
Endesa SA
OTC:ELEZY
|
39.9B USD | 17.7 | |
| US |

|
Nextera Energy Inc
NYSE:NEE
|
196.3B USD | 24 | |
| ES |

|
Iberdrola SA
MAD:IBE
|
129.7B EUR | 20.5 | |
| IT |

|
Enel SpA
MIL:ENEL
|
99.8B EUR | 23.1 | |
| US |

|
Constellation Energy Corp
NASDAQ:CEG
|
107.6B USD | 40 | |
| US |

|
Southern Co
NYSE:SO
|
102.8B USD | 23.7 | |
| US |

|
Duke Energy Corp
NYSE:DUK
|
98.4B USD | 20 | |
| US |

|
American Electric Power Company Inc
NASDAQ:AEP
|
72.7B USD | 20.3 | |
| FR |

|
Electricite de France SA
PAR:EDF
|
46.6B EUR | -2.5 | |
| US |

|
Entergy Corp
NYSE:ETR
|
51.9B USD | 29.5 | |
| US |

|
Xcel Energy Inc
NASDAQ:XEL
|
49.2B USD | 24.4 |
Market Distribution
| Min | 0.1 |
| 30th Percentile | 11 |
| Median | 13.8 |
| 70th Percentile | 20.2 |
| Max | 2 945.9 |
Other Multiples
Endesa SA
Glance View
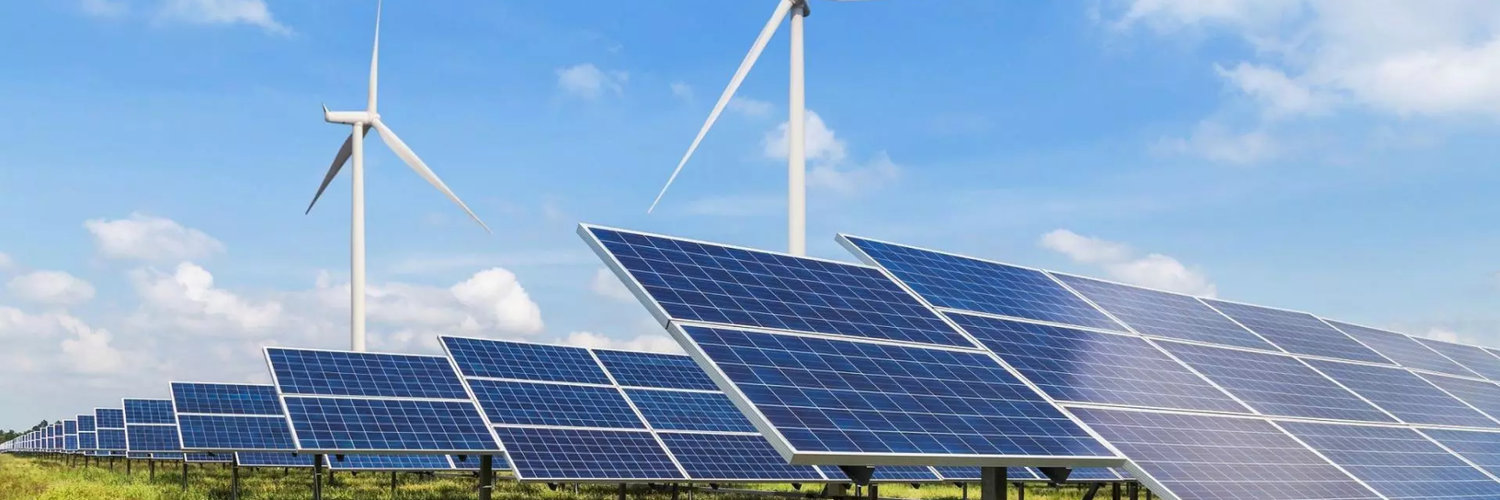
Endesa SA, a name deeply woven into the fabric of Spain's energy landscape, started its journey in 1944 with a clear vision: to electrify a nation rebuilding from the ruins of war. Over the decades, Endesa has transformed from a regional electricity company into a colossal player in the European energy market. Today, it stands as one of the leading electric utility companies in Spain and operates as a subsidiary of the Italian energy giant Enel. While its roots are Spanish, its operational footprint sprawls across various European and Latin American markets, supported by relentless innovation and investment in energy infrastructure. The company's main avenues for revenue generation are its key segments: electricity generation, distribution, and marketing. Dominating the Spanish grid, Endesa supplies power and manages the transmission networks, ensuring reliable electricity flow to both residential and commercial customers. Strategically, Endesa has embraced the energy transition sweeping across the globe. While traditional fossil fuel-based generation continues to form a part of its operations, the company is heavily investing in renewable energy sources to align with global sustainability goals. Wind, solar, and hydropower projects are at the forefront of its expansion efforts. Endesa also capitalizes on ancillary services like energy storage, electric vehicle charging infrastructure, and advanced energy management solutions. By diversifying its service offerings, Endesa is not only aiming for financial robustness but also playing a pivotal role in the decarbonization efforts within its operating regions. The company's ability to harmonize fiscal prudence with forward-thinking green initiatives underscores its enduring legacy in the energy sector, positioning itself as a linchpin in the ongoing transformation of the global energy landscape.
