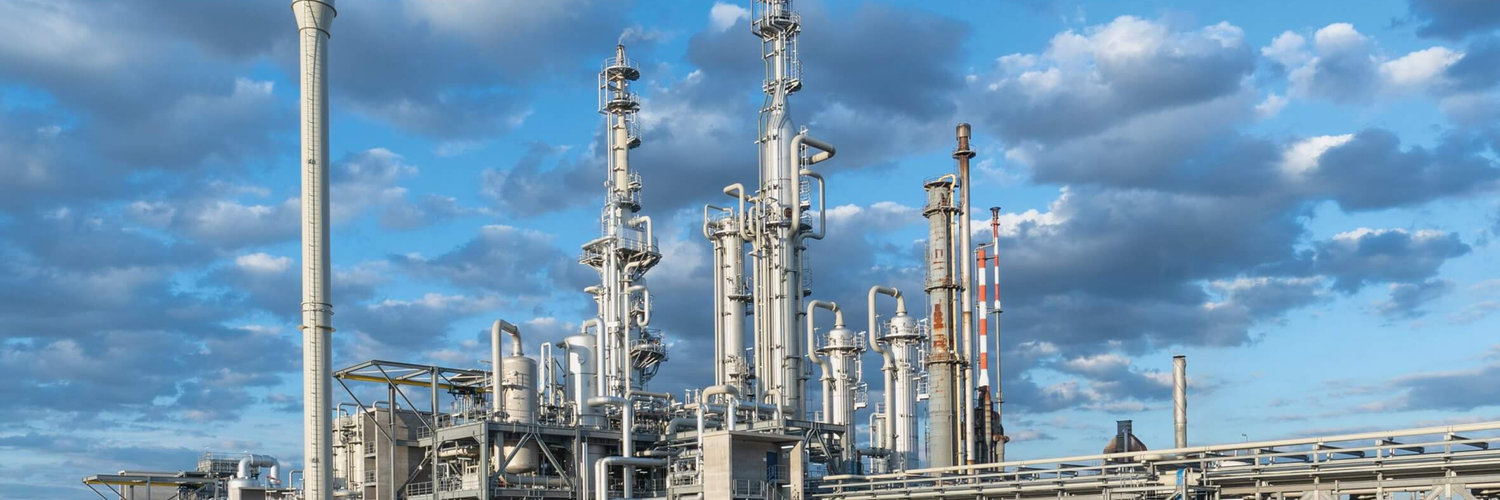

Guanghui Energy Co Ltd
SSE:600256

Decide at what price you'd be comfortable buying and we'll help you stay ready.

|
Guanghui Energy Co Ltd
SSE:600256
|
CN |

|
Pinnacle Financial Partners Inc
NASDAQ:PNFP
|
US |
|
M
|
Mackolik Internet Hizmetleri Ticaret AS
IST:MACKO.E
|
TR |

|
Dai Nippon Printing Co Ltd
TSE:7912
|
JP |

|
Avient Corp
NYSE:AVNT
|
US |

|
China Innovation Investment Ltd
HKEX:1217
|
HK |
|
C
|
CAE Inc
NYSE:CAE
|
CA |

|
Holcim AG
OTC:HCMLF
|
CH |

|
Rail Vikas Nigam Ltd
NSE:RVNL
|
IN |
|
F
|
Fulum Group Holdings Ltd
HKEX:1443
|
HK |

|
American Premium Water Corp
OTC:HIPH
|
US |

|
SuRo Capital Corp
NASDAQ:SSSS
|
US |

|
Mainz Biomed BV
NASDAQ:MYNZ
|
DE |
|
D
|
Doral Group Renewable Energy Resources Ltd
TASE:DORL
|
IL |

|
Majestic Gold Corp
XTSX:MJS
|
CA |
|
Q
|
QTC Energy PCL
SET:QTC
|
TH |
|
Rohto Pharmaceutical Co Ltd
TSE:4527
|
JP |
|
H
|
Hansol Paper Co Ltd
KRX:213500
|
KR |

|
Arvind Fashions Ltd
NSE:ARVINDFASN
|
IN |
|
W
|
Woori Finance Indonesia Tbk PT
IDX:BPFI
|
ID |
|
V
|
Virgin Money UK PLC
ASX:VUK
|
UK |

|
Nukkleus Inc
NASDAQ:NUKK
|
US |

|
Polisan Holding AS
IST:POLHO.E
|
TR |
|
M
|
Mayr Melnhof Karton AG
VSE:MMK
|
AT |
Profitability Summary
Guanghui Energy Co Ltd's profitability score is hidden . We take all the information about a company's profitability (such as its margins, capital efficiency, free cash flow generating ability, and more) and consolidate it into one single number - the profitability score. The higher the profitability score, the more profitable the company is.
Profitability Score
We take all the information about a company's profitability (such as its margins, capital efficiency, free cash flow generating ability, and more) and consolidate it into one single number - the profitability score. The higher the profitability score, the more profitable the company is.
We take all the information about a company's profitability (such as its margins, capital efficiency, free cash flow generating ability, and more) and consolidate it into one single number - the profitability score. The higher the profitability score, the more profitable the company is.
Profitability Score
Margins
Earnings Waterfall
Guanghui Energy Co Ltd
Margins Comparison
Guanghui Energy Co Ltd Competitors
| Country | Company | Market Cap |
Gross Margin |
Operating Margin |
Net Margin |
||
|---|---|---|---|---|---|---|---|
| CN |
|
Guanghui Energy Co Ltd
SSE:600256
|
41.2B CNY |
Loading...
|
Loading...
|
Loading...
|
|
| SA |

|
Saudi Arabian Oil Co
SAU:2222
|
6.7T SAR |
Loading...
|
Loading...
|
Loading...
|
|
| US |

|
Exxon Mobil Corp
NYSE:XOM
|
671.5B USD |
Loading...
|
Loading...
|
Loading...
|
|
| US |

|
Chevron Corp
NYSE:CVX
|
396.8B USD |
Loading...
|
Loading...
|
Loading...
|
|
| CN |

|
PetroChina Co Ltd
SSE:601857
|
2.3T CNY |
Loading...
|
Loading...
|
Loading...
|
|
| NL |
R
|
Royal Dutch Shell PLC
OTC:RYDAF
|
288.2B USD |
Loading...
|
Loading...
|
Loading...
|
|
| UK |

|
Shell PLC
LSE:SHEL
|
202.6B GBP |
Loading...
|
Loading...
|
Loading...
|
|
| FR |

|
TotalEnergies SE
PAR:TTE
|
170.2B EUR |
Loading...
|
Loading...
|
Loading...
|
|
| UK |

|
BP PLC
LSE:BP
|
92.4B GBP |
Loading...
|
Loading...
|
Loading...
|
|
| BR |

|
Petroleo Brasileiro SA Petrobras
BOVESPA:PETR4
|
620.6B BRL |
Loading...
|
Loading...
|
Loading...
|
|
| CN |

|
China Petroleum & Chemical Corp
SSE:600028
|
708.6B CNY |
Loading...
|
Loading...
|
Loading...
|
Return on Capital
Return on Capital Comparison
Guanghui Energy Co Ltd Competitors
| Country | Company | Market Cap | ROE | ROA | ROCE | ROIC | ||
|---|---|---|---|---|---|---|---|---|
| CN |
|
Guanghui Energy Co Ltd
SSE:600256
|
41.2B CNY |
Loading...
|
Loading...
|
Loading...
|
Loading...
|
|
| SA |
|
Saudi Arabian Oil Co
SAU:2222
|
6.7T SAR |
Loading...
|
Loading...
|
Loading...
|
Loading...
|
|
| US |
|
Exxon Mobil Corp
NYSE:XOM
|
671.5B USD |
Loading...
|
Loading...
|
Loading...
|
Loading...
|
|
| US |
|
Chevron Corp
NYSE:CVX
|
396.8B USD |
Loading...
|
Loading...
|
Loading...
|
Loading...
|
|
| CN |
|
PetroChina Co Ltd
SSE:601857
|
2.3T CNY |
Loading...
|
Loading...
|
Loading...
|
Loading...
|
|
| NL |
R
|
Royal Dutch Shell PLC
OTC:RYDAF
|
288.2B USD |
Loading...
|
Loading...
|
Loading...
|
Loading...
|
|
| UK |
|
Shell PLC
LSE:SHEL
|
202.6B GBP |
Loading...
|
Loading...
|
Loading...
|
Loading...
|
|
| FR |
|
TotalEnergies SE
PAR:TTE
|
170.2B EUR |
Loading...
|
Loading...
|
Loading...
|
Loading...
|
|
| UK |
|
BP PLC
LSE:BP
|
92.4B GBP |
Loading...
|
Loading...
|
Loading...
|
Loading...
|
|
| BR |
|
Petroleo Brasileiro SA Petrobras
BOVESPA:PETR4
|
620.6B BRL |
Loading...
|
Loading...
|
Loading...
|
Loading...
|
|
| CN |
|
China Petroleum & Chemical Corp
SSE:600028
|
708.6B CNY |
Loading...
|
Loading...
|
Loading...
|
Loading...
|
