


Mie Kotsu Group Holdings Inc
TSE:3232


Utilize notes to systematically review your investment decisions. By reflecting on past outcomes, you can discern effective strategies and identify those that underperformed. This continuous feedback loop enables you to adapt and refine your approach, optimizing for future success.
Each note serves as a learning point, offering insights into your decision-making processes. Over time, you'll accumulate a personalized database of knowledge, enhancing your ability to make informed decisions quickly and effectively.
With a comprehensive record of your investment history at your fingertips, you can compare current opportunities against past experiences. This not only bolsters your confidence but also ensures that each decision is grounded in a well-documented rationale.
Do you really want to delete this note?
This action cannot be undone.

| 52 Week Range |
448
571
|
| Price Target |
|
We'll email you a reminder when the closing price reaches JPY.
Choose the stock you wish to monitor with a price alert.
This alert will be permanently deleted.
Operating Margin
Operating Margin shows how much profit a company makes from its regular business activities after covering operating costs. It helps measure how efficiently the company turns sales into profit.
Operating Margin shows how much profit a company makes from its regular business activities after covering operating costs. It helps measure how efficiently the company turns sales into profit.
Peer Comparison
| Country | Company | Market Cap |
Operating Margin |
||
|---|---|---|---|---|---|
| JP |
|
Mie Kotsu Group Holdings Inc
TSE:3232
|
57.4B JPY |
Loading...
|
|
| US |

|
General Electric Co
NYSE:GE
|
307.7B USD |
Loading...
|
|
| DE |

|
Siemens AG
XETRA:SIE
|
198.5B EUR |
Loading...
|
|
| JP |

|
Hitachi Ltd
TSE:6501
|
24T JPY |
Loading...
|
|
| US |

|
Honeywell International Inc
NASDAQ:HON
|
141.2B USD |
Loading...
|
|
| US |

|
3M Co
NYSE:MMM
|
85.9B USD |
Loading...
|
|
| CN |

|
CITIC Ltd
HKEX:267
|
347.6B HKD |
Loading...
|
|
| US |
R
|
Roper Technologies Inc
F:ROP
|
37.1B EUR |
Loading...
|
|
| KR |

|
Samsung C&T Corp
KRX:028260
|
50T KRW |
Loading...
|
|
| HK |

|
CK Hutchison Holdings Ltd
HKEX:1
|
240.5B HKD |
Loading...
|
|
| HK |

|
Jardine Matheson Holdings Ltd
SGX:J36
|
22.1B USD |
Loading...
|
Market Distribution
| Min | -125 500% |
| 30th Percentile | 4.2% |
| Median | 7% |
| 70th Percentile | 10.6% |
| Max | 9 743.7% |
Other Profitability Ratios
Mie Kotsu Group Holdings Inc
Glance View
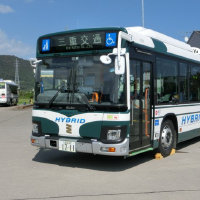
Mie Kotsu Group Holdings, Inc. engages in the management of its subsidiaries which are in the transportation, real estate, and leisure industries. The company is headquartered in Tsu-Shi, Mie-Ken and currently employs 3,338 full-time employees. The company went IPO on 2006-10-01. The Transportation segment is involved in bus, taxi and railway transportation businesses, as well as leasing of asset. The Real Estate segment is involved in the sale, brokerage, leasing, appraisal and management of real estate, as well as construction of house. The Distribution segment is involved in sale of petroleum product, daily goods, truck and bus. The Leisure and Service segment is involved in travel placement, the operation of Japanese-style hotel, business hotel, drive-in, ropeway, golf course and driving school.
See Also
Operating Margin is calculated by dividing the Operating Income by the Revenue.
The current Operating Margin for Mie Kotsu Group Holdings Inc is 8.3%, which is above its 3-year median of 7.9%.
Over the last 3 years, Mie Kotsu Group Holdings Inc’s Operating Margin has increased from 5.8% to 8.3%. During this period, it reached a low of 5.8% on Aug 30, 2022 and a high of 8.6% on Sep 30, 2024.

