
Minebea Mitsumi Inc
TSE:6479

Decide at what price you'd be comfortable buying and we'll help you stay ready.

|
Johnson & Johnson
NYSE:JNJ
|
US |

|
Berkshire Hathaway Inc
NYSE:BRK.A
|
US |

|
Bank of America Corp
NYSE:BAC
|
US |

|
Mastercard Inc
NYSE:MA
|
US |

|
UnitedHealth Group Inc
NYSE:UNH
|
US |

|
Exxon Mobil Corp
NYSE:XOM
|
US |

|
Pfizer Inc
NYSE:PFE
|
US |

|
Nike Inc
NYSE:NKE
|
US |

|
Visa Inc
NYSE:V
|
US |

|
Alibaba Group Holding Ltd
NYSE:BABA
|
CN |

|
JPMorgan Chase & Co
NYSE:JPM
|
US |

|
Coca-Cola Co
NYSE:KO
|
US |

|
Verizon Communications Inc
NYSE:VZ
|
US |

|
Chevron Corp
NYSE:CVX
|
US |

|
Walt Disney Co
NYSE:DIS
|
US |

|
PayPal Holdings Inc
NASDAQ:PYPL
|
US |
P/S
Price to Sales (P/S) ratio shows how much investors pay for each dollar of a company`s sales. It`s calculated by dividing the company`s market value by its total revenue.
Price to Sales (P/S) ratio shows how much investors pay for each dollar of a company`s sales. It`s calculated by dividing the company`s market value by its total revenue.
Valuation Scenarios
If P/S returns to its 3-Year Average (0.8), the stock would be worth ¥2 948.11 (6% downside from current price).
| Scenario | P/S Value | Implied Price | Upside/Downside |
|---|---|---|---|
| Current Multiple | 0.8 | ¥3 124 |
0%
|
| 3-Year Average | 0.8 | ¥2 948.11 |
-6%
|
| 5-Year Average | 0.8 | ¥3 150.49 |
+1%
|
| Industry Average | 1.2 | ¥4 710.92 |
+51%
|
| Country Average | 1.1 | ¥4 325.18 |
+38%
|
Forward P/S
Today’s price vs future revenue
| Today's Market Cap | Revenue | Forward P/S | ||
|---|---|---|---|---|
|
¥1.3T
|
/ |
Jan 2026
¥1.6T
|
= |
|
|
¥1.3T
|
/ |
Mar 2026
¥1.6T
|
= |
|
|
¥1.3T
|
/ |
Mar 2027
¥1.7T
|
= |
|
|
¥1.3T
|
/ |
Mar 2028
¥1.7T
|
= |
|
Forward P/S shows whether today’s P/S still looks high or low once future revenue are taken into account.
Peer Comparison
| Market Cap | P/S | P/E | ||||
|---|---|---|---|---|---|---|
| JP |

|
Minebea Mitsumi Inc
TSE:6479
|
1.2T JPY | 0.8 | 19.6 | |
| JP |
F
|
Fujitec Co Ltd
TSE:6406
|
2 720 795.8T JPY | 0 | 0 | |
| JP |
I
|
Ishii Iron Works Co Ltd
TSE:6362
|
304.2T JPY | 28 119.8 | 363 670.8 | |
| JP |
S
|
Star Micronics Co Ltd
TSE:7718
|
48T JPY | 1.4 | 29.8 | |
| US |

|
Parker-Hannifin Corp
NYSE:PH
|
119.6B USD | 5.8 | 33.8 | |
| JP |

|
Freund Corp
TSE:6312
|
16.9T JPY | 607.7 | 8 494.3 | |
| JP |

|
Mitsubishi Heavy Industries Ltd
TSE:7011
|
16.1T JPY | 3.3 | 55.2 | |
| SE |

|
Atlas Copco AB
STO:ATCO A
|
839.4B SEK | 5 | 31.8 | |
| US |

|
Illinois Tool Works Inc
NYSE:ITW
|
76.7B USD | 4.8 | 24.9 | |
| US |

|
Barnes Group Inc
NYSE:B
|
64.4B USD | 3.8 | 12.8 | |
| SE |

|
Sandvik AB
STO:SAND
|
477B SEK | 3.9 | 32.2 |
Market Distribution
| Min | 0 |
| 30th Percentile | 0.7 |
| Median | 1.1 |
| 70th Percentile | 1.9 |
| Max | 12 107 466 |
Other Multiples
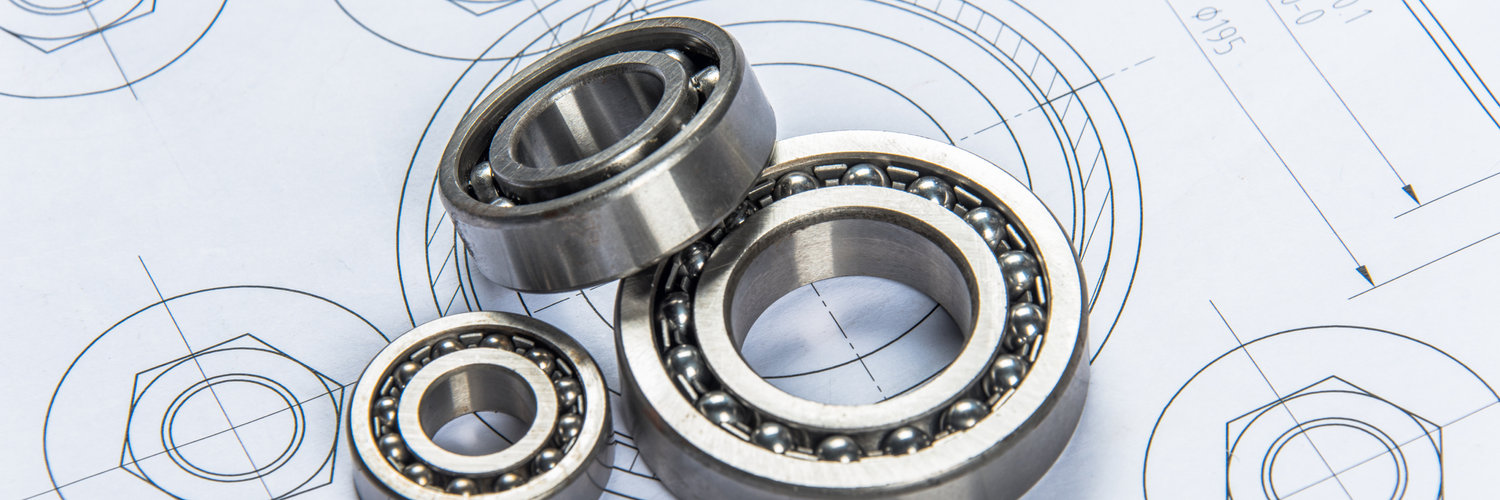
Minebea Mitsumi Inc
Glance View
In the vast landscape of precision component manufacturing, Minebea Mitsumi Inc. stands out as a global powerhouse with a legacy rooted in innovation and relentless pursuit of quality. The company's journey began in 1951, initially as a small ball bearing manufacturer. Over the decades, it evolved into a multifaceted entity producing a wide array of precision components, including motors, electronic devices, and even cutting-edge sensor technology. This transformation was driven by its commitment to serve industries ranging from aerospace to consumer electronics, and its ability to adapt to the shifting sands of technology. Minebea Mitsumi's operations are deeply integrated, with its subsidiaries and affiliates spanning the globe, creating a symbiotic ecosystem that enhances efficiency and innovation. Minebea Mitsumi makes money by leveraging its diverse product portfolio and deep market penetration. Its revenues are anchored in its robust production of bearings, a staple component used in countless mechanical applications. The company capitalizes on economies of scale, producing billions of units annually and fulfilling the cornerstone needs of automotive, industrial, and electronic clients worldwide. Moreover, its strategic acquisitions have strengthened its foothold in the electronics sector, enabling it to supply key components like LED backlights and antennas to leading tech manufacturers. By constantly refining its manufacturing processes and embracing technological advancements, Minebea Mitsumi ensures a steady stream of revenues and sustains its position as a critical supplier in multiple high-demand markets.
