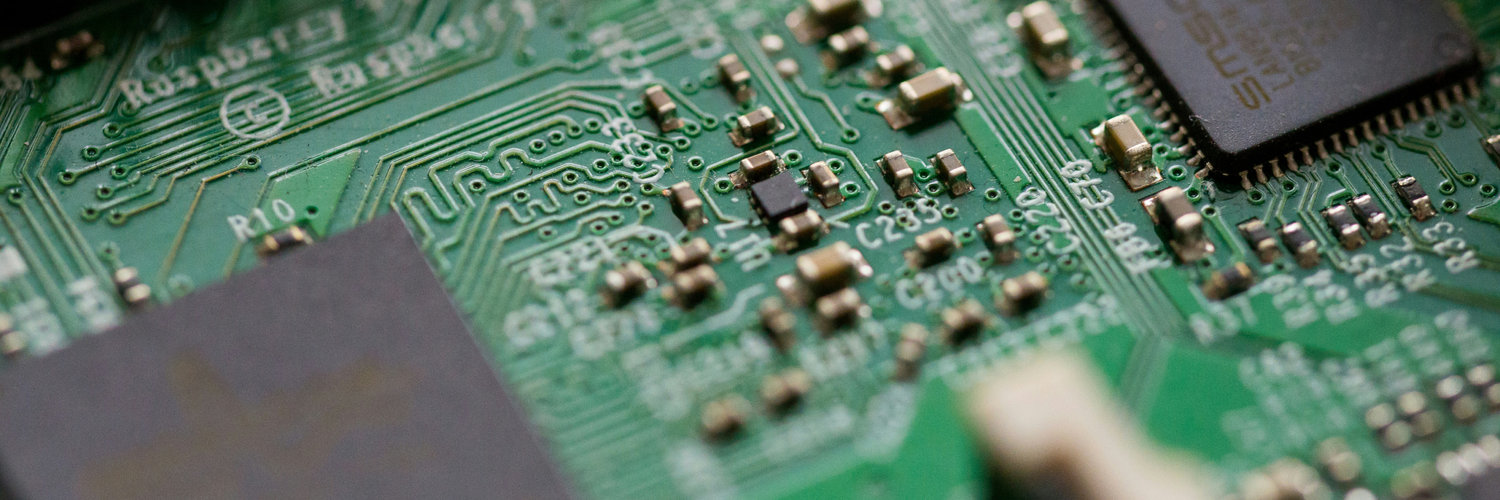
Lite-On Technology Corp
TWSE:2301

Decide at what price you'd be comfortable buying and we'll help you stay ready.
|
Lite-On Technology Corp
TWSE:2301
|
TW |

|
Qualcomm Inc
NASDAQ:QCOM
|
US |
|
Triangle Tyre Co Ltd
SSE:601163
|
CN |
|
Television Francaise 1 SA
PAR:TFI
|
FR |
|
Ergomed PLC
LSE:ERGO
|
UK |
Profitability Summary
Lite-On Technology Corp's profitability score is hidden . We take all the information about a company's profitability (such as its margins, capital efficiency, free cash flow generating ability, and more) and consolidate it into one single number - the profitability score. The higher the profitability score, the more profitable the company is.
Profitability Score
We take all the information about a company's profitability (such as its margins, capital efficiency, free cash flow generating ability, and more) and consolidate it into one single number - the profitability score. The higher the profitability score, the more profitable the company is.
We take all the information about a company's profitability (such as its margins, capital efficiency, free cash flow generating ability, and more) and consolidate it into one single number - the profitability score. The higher the profitability score, the more profitable the company is.
Profitability Score
Margins
Earnings Waterfall
Lite-On Technology Corp
Margins Comparison
Lite-On Technology Corp Competitors
| Country | Company | Market Cap |
Gross Margin |
Operating Margin |
Net Margin |
||
|---|---|---|---|---|---|---|---|
| TW |
|
Lite-On Technology Corp
TWSE:2301
|
376.8B TWD |
Loading...
|
Loading...
|
Loading...
|
|
| US |

|
Apple Inc
NASDAQ:AAPL
|
4.1T USD |
Loading...
|
Loading...
|
Loading...
|
|
| KR |

|
Samsung Electronics Co Ltd
KRX:005930
|
1 462T KRW |
Loading...
|
Loading...
|
Loading...
|
|
| US |
S
|
SanDisk Corp
NASDAQ:SNDK
|
175.7B USD |
Loading...
|
Loading...
|
Loading...
|
|
| IE |

|
Seagate Technology Holdings PLC
NASDAQ:STX
|
162.8B USD |
Loading...
|
Loading...
|
Loading...
|
|
| US |

|
Western Digital Corp
NASDAQ:WDC
|
146.3B USD |
Loading...
|
Loading...
|
Loading...
|
|
| US |

|
Dell Technologies Inc
NYSE:DELL
|
139.3B USD |
Loading...
|
Loading...
|
Loading...
|
|
| CN |

|
Xiaomi Corp
HKEX:1810
|
755.9B HKD |
Loading...
|
Loading...
|
Loading...
|
|
| SG |
S
|
Seagate Technology Holdings PLC
XBER:847
|
74.8B EUR |
Loading...
|
Loading...
|
Loading...
|
|
| US |

|
Hewlett Packard Enterprise Co
NYSE:HPE
|
38B USD |
Loading...
|
Loading...
|
Loading...
|
|
| TW |

|
Quanta Computer Inc
TWSE:2382
|
1.2T TWD |
Loading...
|
Loading...
|
Loading...
|
Return on Capital
Return on Capital Comparison
Lite-On Technology Corp Competitors
| Country | Company | Market Cap | ROE | ROA | ROCE | ROIC | ||
|---|---|---|---|---|---|---|---|---|
| TW |
|
Lite-On Technology Corp
TWSE:2301
|
376.8B TWD |
Loading...
|
Loading...
|
Loading...
|
Loading...
|
|
| US |
|
Apple Inc
NASDAQ:AAPL
|
4.1T USD |
Loading...
|
Loading...
|
Loading...
|
Loading...
|
|
| KR |
|
Samsung Electronics Co Ltd
KRX:005930
|
1 462T KRW |
Loading...
|
Loading...
|
Loading...
|
Loading...
|
|
| US |
S
|
SanDisk Corp
NASDAQ:SNDK
|
175.7B USD |
Loading...
|
Loading...
|
Loading...
|
Loading...
|
|
| IE |
|
Seagate Technology Holdings PLC
NASDAQ:STX
|
162.8B USD |
Loading...
|
Loading...
|
Loading...
|
Loading...
|
|
| US |
|
Western Digital Corp
NASDAQ:WDC
|
146.3B USD |
Loading...
|
Loading...
|
Loading...
|
Loading...
|
|
| US |
|
Dell Technologies Inc
NYSE:DELL
|
139.3B USD |
Loading...
|
Loading...
|
Loading...
|
Loading...
|
|
| CN |
|
Xiaomi Corp
HKEX:1810
|
755.9B HKD |
Loading...
|
Loading...
|
Loading...
|
Loading...
|
|
| SG |
S
|
Seagate Technology Holdings PLC
XBER:847
|
74.8B EUR |
Loading...
|
Loading...
|
Loading...
|
Loading...
|
|
| US |
|
Hewlett Packard Enterprise Co
NYSE:HPE
|
38B USD |
Loading...
|
Loading...
|
Loading...
|
Loading...
|
|
| TW |
|
Quanta Computer Inc
TWSE:2382
|
1.2T TWD |
Loading...
|
Loading...
|
Loading...
|
Loading...
|
