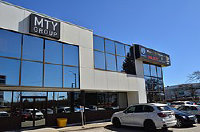
Golden Ponder Holdings Ltd
HKEX:1783

Balance Sheet
Balance Sheet Decomposition
Golden Ponder Holdings Ltd

| Current Assets | 340.9m |
| Cash & Short-Term Investments | 55.1m |
| Receivables | 251m |
| Other Current Assets | 34.8m |
| Non-Current Assets | 141.5m |
| Long-Term Investments | 28.8m |
| PP&E | 31.9m |
| Intangibles | 76.9m |
| Other Non-Current Assets | 3.8m |
| Current Liabilities | 214.9m |
| Accounts Payable | 94.5m |
| Accrued Liabilities | 5.4m |
| Other Current Liabilities | 114.9m |
| Non-Current Liabilities | 6.6m |
| Long-Term Debt | 2.3m |
| Other Non-Current Liabilities | 4.3m |
Balance Sheet
Golden Ponder Holdings Ltd

| Mar-2016 | Mar-2017 | Mar-2018 | Mar-2019 | Mar-2020 | Mar-2021 | Mar-2022 | Mar-2023 | ||
|---|---|---|---|---|---|---|---|---|---|
| Assets | |||||||||
| Cash & Cash Equivalents |
20
|
36
|
25
|
63
|
109
|
89
|
87
|
71
|
|
| Cash Equivalents |
20
|
36
|
25
|
63
|
109
|
89
|
87
|
71
|
|
| Total Receivables |
72
|
49
|
142
|
186
|
124
|
97
|
192
|
116
|
|
| Accounts Receivables |
40
|
32
|
75
|
183
|
120
|
95
|
191
|
113
|
|
| Other Receivables |
33
|
17
|
67
|
3
|
4
|
2
|
1
|
3
|
|
| Inventory |
0
|
0
|
0
|
0
|
0
|
0
|
0
|
0
|
|
| Other Current Assets |
9
|
13
|
19
|
47
|
40
|
27
|
70
|
34
|
|
| Total Current Assets |
101
|
97
|
186
|
296
|
272
|
213
|
349
|
222
|
|
| PP&E Net |
1
|
1
|
1
|
2
|
3
|
2
|
9
|
33
|
|
| PP&E Gross |
0
|
0
|
1
|
2
|
3
|
2
|
9
|
33
|
|
| Accumulated Depreciation |
0
|
0
|
1
|
0
|
2
|
4
|
5
|
16
|
|
| Intangible Assets |
0
|
0
|
0
|
0
|
0
|
0
|
1
|
3
|
|
| Goodwill |
0
|
0
|
0
|
0
|
0
|
0
|
0
|
75
|
|
| Long-Term Investments |
0
|
0
|
0
|
0
|
0
|
0
|
0
|
31
|
|
| Other Long-Term Assets |
0
|
0
|
0
|
0
|
9
|
20
|
1
|
3
|
|
| Other Assets |
0
|
0
|
0
|
0
|
0
|
0
|
0
|
75
|
|
| Total Assets |
103
N/A
|
99
-4%
|
187
+90%
|
299
+60%
|
285
-5%
|
234
-18%
|
361
+54%
|
368
+2%
|
|
| Liabilities | |||||||||
| Accounts Payable |
41
|
26
|
57
|
64
|
61
|
39
|
139
|
50
|
|
| Accrued Liabilities |
2
|
11
|
4
|
9
|
11
|
14
|
15
|
4
|
|
| Short-Term Debt |
10
|
13
|
9
|
0
|
0
|
0
|
0
|
43
|
|
| Current Portion of Long-Term Debt |
0
|
0
|
0
|
0
|
1
|
1
|
1
|
7
|
|
| Other Current Liabilities |
7
|
3
|
34
|
36
|
24
|
13
|
50
|
66
|
|
| Total Current Liabilities |
60
|
53
|
104
|
108
|
96
|
66
|
205
|
170
|
|
| Long-Term Debt |
0
|
0
|
0
|
0
|
1
|
0
|
0
|
5
|
|
| Deferred Income Tax |
0
|
0
|
0
|
0
|
0
|
0
|
0
|
1
|
|
| Minority Interest |
0
|
0
|
0
|
0
|
0
|
0
|
0
|
0
|
|
| Other Liabilities |
0
|
0
|
0
|
0
|
0
|
0
|
0
|
4
|
|
| Total Liabilities |
60
N/A
|
53
-11%
|
104
+94%
|
108
+4%
|
97
-11%
|
66
-32%
|
205
+209%
|
179
-12%
|
|
| Equity | |||||||||
| Common Stock |
0
|
0
|
0
|
8
|
8
|
8
|
8
|
10
|
|
| Retained Earnings |
42
|
45
|
83
|
94
|
92
|
72
|
53
|
25
|
|
| Additional Paid In Capital |
0
|
0
|
0
|
88
|
88
|
88
|
95
|
156
|
|
| Unrealized Security Profit/Loss |
0
|
0
|
0
|
0
|
0
|
0
|
0
|
3
|
|
| Total Equity |
42
N/A
|
45
+6%
|
83
+85%
|
190
+128%
|
188
-1%
|
168
-11%
|
156
-7%
|
188
+21%
|
|
| Total Liabilities & Equity |
103
N/A
|
99
-4%
|
187
+90%
|
299
+60%
|
285
-5%
|
234
-18%
|
361
+54%
|
368
+2%
|
|
| Shares Outstanding | |||||||||
| Common Shares Outstanding |
600
|
600
|
600
|
800
|
800
|
800
|
827
|
959
|
|


 You don't have any saved screeners yet
