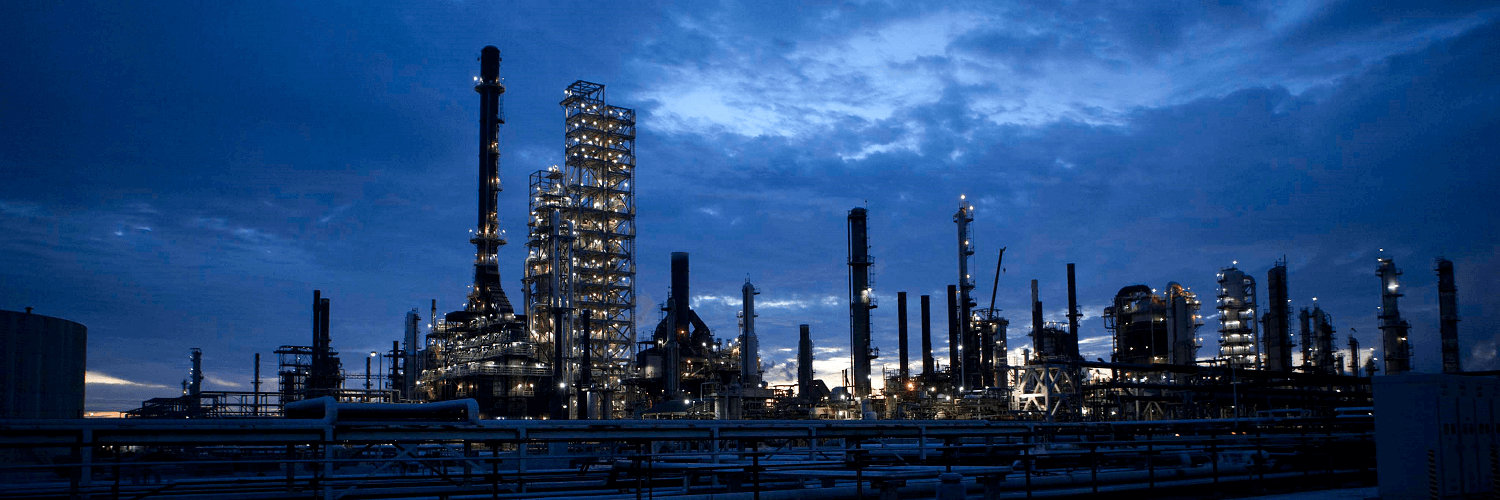

Chevron Corp
LSE:0R2Q

Decide at what price you'd be comfortable buying and we'll help you stay ready.
|
C
|
Chevron Corp
LSE:0R2Q
|
US |

|
O'Key Group SA
LSE:OKEY
|
LU |

|
China Three Gorges Renewables Group Co Ltd
SSE:600905
|
CN |

|
Kalnorth Gold Mines Ltd
ASX:KGM
|
AU |

|
Bafang Electric Suzhou Co Ltd
SSE:603489
|
CN |
|
Natural Capsules Ltd
BSE:524654
|
IN |
|
S
|
Simmonds Marshall Ltd
BSE:507998
|
IN |

|
Springfield Properties PLC
LSE:SPR
|
UK |
|
H
|
Hang Zhou Iron & Steel Co Ltd
SSE:600126
|
CN |

|
Kweichow Moutai Co Ltd
SSE:600519
|
CN |

|
Barco NV
XBRU:BAR
|
BE |
|
X
|
Xinyu Iron & Steel Co Ltd
SSE:600782
|
CN |
|
BNR Udyog Ltd
BSE:530809
|
IN |

|
Rudrabhishek Enterprises Ltd
NSE:REPL
|
IN |
|
J
|
JD Food PCL
SET:JDF
|
TH |

|
Industrials REIT Ltd
LSE:MLI
|
UK |
|
I
|
IMAC Holdings Inc
NASDAQ:BACK
|
US |

|
ACADIA Pharmaceuticals Inc
NASDAQ:ACAD
|
US |

|
Santana Minerals Ltd
ASX:SMI
|
AU |

|
Amman Mineral Internasional Tbk PT
IDX:AMMN
|
ID |
Profitability Summary
Chevron Corp's profitability score is hidden . We take all the information about a company's profitability (such as its margins, capital efficiency, free cash flow generating ability, and more) and consolidate it into one single number - the profitability score. The higher the profitability score, the more profitable the company is.
Profitability Score
We take all the information about a company's profitability (such as its margins, capital efficiency, free cash flow generating ability, and more) and consolidate it into one single number - the profitability score. The higher the profitability score, the more profitable the company is.
We take all the information about a company's profitability (such as its margins, capital efficiency, free cash flow generating ability, and more) and consolidate it into one single number - the profitability score. The higher the profitability score, the more profitable the company is.
Profitability Score
Margins
Earnings Waterfall
Chevron Corp

Margins Comparison
Chevron Corp Competitors
| Country | Company | Market Cap |
Gross Margin |
Operating Margin |
Net Margin |
||
|---|---|---|---|---|---|---|---|
| US |
|
Chevron Corp
NYSE:CVX
|
402.3B USD |
Loading...
|
Loading...
|
Loading...
|
|
| SA |

|
Saudi Arabian Oil Co
SAU:2222
|
6.7T SAR |
Loading...
|
Loading...
|
Loading...
|
|
| US |

|
Exxon Mobil Corp
NYSE:XOM
|
667.3B USD |
Loading...
|
Loading...
|
Loading...
|
|
| NL |
R
|
Royal Dutch Shell PLC
OTC:RYDAF
|
290B USD |
Loading...
|
Loading...
|
Loading...
|
|
| UK |

|
Shell PLC
LSE:SHEL
|
196.4B GBP |
Loading...
|
Loading...
|
Loading...
|
|
| FR |

|
TotalEnergies SE
PAR:TTE
|
164.9B EUR |
Loading...
|
Loading...
|
Loading...
|
|
| US |

|
Conocophillips
NYSE:COP
|
155.5B USD |
Loading...
|
Loading...
|
Loading...
|
|
| UK |

|
BP PLC
LSE:BP
|
87.9B GBP |
Loading...
|
Loading...
|
Loading...
|
|
| BR |

|
Petroleo Brasileiro SA Petrobras
BOVESPA:PETR4
|
588.6B BRL |
Loading...
|
Loading...
|
Loading...
|
|
| CN |

|
China Petroleum & Chemical Corp
SSE:600028
|
736.8B CNY |
Loading...
|
Loading...
|
Loading...
|
|
| NO |

|
Equinor ASA
OSE:EQNR
|
987.6B NOK |
Loading...
|
Loading...
|
Loading...
|
Return on Capital
Return on Capital Comparison
Chevron Corp Competitors
| Country | Company | Market Cap | ROE | ROA | ROCE | ROIC | ||
|---|---|---|---|---|---|---|---|---|
| US |
|
Chevron Corp
NYSE:CVX
|
402.3B USD |
Loading...
|
Loading...
|
Loading...
|
Loading...
|
|
| SA |
|
Saudi Arabian Oil Co
SAU:2222
|
6.7T SAR |
Loading...
|
Loading...
|
Loading...
|
Loading...
|
|
| US |
|
Exxon Mobil Corp
NYSE:XOM
|
667.3B USD |
Loading...
|
Loading...
|
Loading...
|
Loading...
|
|
| NL |
R
|
Royal Dutch Shell PLC
OTC:RYDAF
|
290B USD |
Loading...
|
Loading...
|
Loading...
|
Loading...
|
|
| UK |
|
Shell PLC
LSE:SHEL
|
196.4B GBP |
Loading...
|
Loading...
|
Loading...
|
Loading...
|
|
| FR |
|
TotalEnergies SE
PAR:TTE
|
164.9B EUR |
Loading...
|
Loading...
|
Loading...
|
Loading...
|
|
| US |
|
Conocophillips
NYSE:COP
|
155.5B USD |
Loading...
|
Loading...
|
Loading...
|
Loading...
|
|
| UK |
|
BP PLC
LSE:BP
|
87.9B GBP |
Loading...
|
Loading...
|
Loading...
|
Loading...
|
|
| BR |
|
Petroleo Brasileiro SA Petrobras
BOVESPA:PETR4
|
588.6B BRL |
Loading...
|
Loading...
|
Loading...
|
Loading...
|
|
| CN |
|
China Petroleum & Chemical Corp
SSE:600028
|
736.8B CNY |
Loading...
|
Loading...
|
Loading...
|
Loading...
|
|
| NO |
|
Equinor ASA
OSE:EQNR
|
987.6B NOK |
Loading...
|
Loading...
|
Loading...
|
Loading...
|
