BP PLC
LSE:BP

Decide at what price you'd be comfortable buying and we'll help you stay ready.

|
Johnson & Johnson
NYSE:JNJ
|
US |

|
Berkshire Hathaway Inc
NYSE:BRK.A
|
US |

|
Bank of America Corp
NYSE:BAC
|
US |

|
Mastercard Inc
NYSE:MA
|
US |

|
UnitedHealth Group Inc
NYSE:UNH
|
US |

|
Exxon Mobil Corp
NYSE:XOM
|
US |

|
Pfizer Inc
NYSE:PFE
|
US |

|
Nike Inc
NYSE:NKE
|
US |

|
Visa Inc
NYSE:V
|
US |

|
Alibaba Group Holding Ltd
NYSE:BABA
|
CN |

|
JPMorgan Chase & Co
NYSE:JPM
|
US |

|
Coca-Cola Co
NYSE:KO
|
US |

|
Verizon Communications Inc
NYSE:VZ
|
US |

|
Chevron Corp
NYSE:CVX
|
US |

|
Walt Disney Co
NYSE:DIS
|
US |

|
PayPal Holdings Inc
NASDAQ:PYPL
|
US |
P/B
Price to Book (P/B) ratio compares a company`s market value to its book value. It shows how much investors are paying for each dollar of net assets on the balance sheet.
Price to Book (P/B) ratio compares a company`s market value to its book value. It shows how much investors are paying for each dollar of net assets on the balance sheet.
Valuation Scenarios
If P/B returns to its 3-Year Average (1.5), the stock would be worth GBX377.3 (36% downside from current price).
| Scenario | P/B Value | Implied Price | Upside/Downside |
|---|---|---|---|
| Current Multiple | 2.3 | GBX586.9 |
0%
|
| 3-Year Average | 1.5 | GBX377.3 |
-36%
|
| 5-Year Average | 1.4 | GBX366.21 |
-38%
|
| Industry Average | 0 | GBX3.12 |
-99%
|
| Country Average | 0 | GBX5.79 |
-99%
|
Forward P/B
Today’s price vs future total equity
Peer Comparison
| Market Cap | P/B | P/E | ||||
|---|---|---|---|---|---|---|
| UK |

|
BP PLC
LSE:BP
|
89.5B GBP | 2.3 | 2 249.2 | |
| SA |

|
Saudi Arabian Oil Co
SAU:2222
|
6.7T SAR | 4.5 | 19.3 | |
| US |
|
Exxon Mobil Corp
NYSE:XOM
|
619.3B USD | 2.4 | 21.5 | |
| US |
|
Chevron Corp
NYSE:CVX
|
368.5B USD | 2 | 30 | |
| CN |

|
PetroChina Co Ltd
SSE:601857
|
2.2T CNY | 1.4 | 13.9 | |
| NL |
R
|
Royal Dutch Shell PLC
OTC:RYDAF
|
281.8B USD | 1.6 | 15.8 | |
| UK |

|
Shell PLC
LSE:SHEL
|
186B GBP | 1.4 | 14.1 | |
| FR |

|
TotalEnergies SE
PAR:TTE
|
164.6B EUR | 1.7 | 15.3 | |
| BR |

|
Petroleo Brasileiro SA Petrobras
BOVESPA:PETR4
|
610.6B BRL | 1.5 | 5.5 | |
| NO |

|
Equinor ASA
OSE:EQNR
|
890.1B NOK | 2.4 | 19.5 | |
| CN |

|
China Petroleum & Chemical Corp
SSE:600028
|
645.7B CNY | 0.8 | 20.3 |
Market Distribution
| Min | 0 |
| 30th Percentile | 0 |
| Median | 0 |
| 70th Percentile | 0 |
| Max | 49 422.3 |
Other Multiples
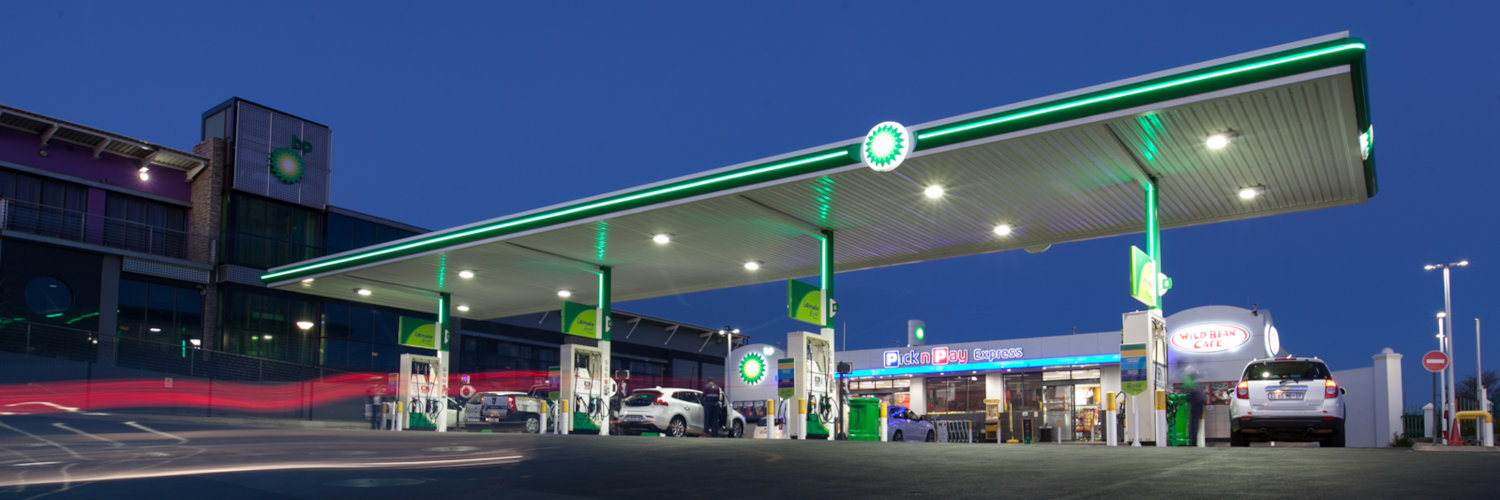
BP PLC
Glance View
BP PLC, once known predominantly for its petroleum prowess, has evolved into a multifaceted energy conglomerate. Rooted in its origins as the Anglo-Persian Oil Company over a century ago, BP today stands at the intersection of traditional oil exploration and production, and the burgeoning world of renewable energy. With sprawling operations in oil and gas, the company drills into the heart of the earth to harness crude oil, transforming it into gasoline and diesel that power vehicles globally. The upstream segment, responsible for extraction and production, generates substantial revenues, which are then bolstered by the downstream operations, refining crude into high-demand products and distributing them through a vast network of service stations worldwide. Not stopping at hydrocarbons, BP has been steering its colossal ship towards a more sustainable future, investing heavily in renewables. The company's ventures into wind and solar energy, alongside biofuels and electric vehicle charging infrastructure, demonstrate its commitment to the energy transition. While oil and gas remain significant pillars of BP's financial engine, these green initiatives represent a strategic pivot designed to balance the scales of profit and planetary stewardship. This ongoing transformation reflects BP's response to global environmental challenges, positioning it to not only meet the energy demands of today but to shape the cleaner energy landscape of tomorrow.
