Garmin Ltd
NYSE:GRMN

| US |

|
Johnson & Johnson
NYSE:JNJ
|
Pharmaceuticals
|
| US |

|
Berkshire Hathaway Inc
NYSE:BRK.A
|
Financial Services
|
| US |

|
Bank of America Corp
NYSE:BAC
|
Banking
|
| US |

|
Mastercard Inc
NYSE:MA
|
Technology
|
| US |

|
Abbvie Inc
NYSE:ABBV
|
Biotechnology
|
| US |

|
Pfizer Inc
NYSE:PFE
|
Pharmaceuticals
|
| US |

|
Palantir Technologies Inc
NYSE:PLTR
|
Technology
|
| US |

|
Nike Inc
NYSE:NKE
|
Textiles, Apparel & Luxury Goods
|
| US |

|
Visa Inc
NYSE:V
|
Technology
|
| CN |

|
Alibaba Group Holding Ltd
NYSE:BABA
|
Retail
|
| US |

|
3M Co
NYSE:MMM
|
Industrial Conglomerates
|
| US |

|
JPMorgan Chase & Co
NYSE:JPM
|
Banking
|
| US |

|
Coca-Cola Co
NYSE:KO
|
Beverages
|
| US |

|
Realty Income Corp
NYSE:O
|
Real Estate
|
| US |

|
Walt Disney Co
NYSE:DIS
|
Media
|
| US |

|
PayPal Holdings Inc
NASDAQ:PYPL
|
Technology
|

Utilize notes to systematically review your investment decisions. By reflecting on past outcomes, you can discern effective strategies and identify those that underperformed. This continuous feedback loop enables you to adapt and refine your approach, optimizing for future success.
Each note serves as a learning point, offering insights into your decision-making processes. Over time, you'll accumulate a personalized database of knowledge, enhancing your ability to make informed decisions quickly and effectively.
With a comprehensive record of your investment history at your fingertips, you can compare current opportunities against past experiences. This not only bolsters your confidence but also ensures that each decision is grounded in a well-documented rationale.
Do you really want to delete this note?
This action cannot be undone.

| 52 Week Range |
99.71
177.94
|
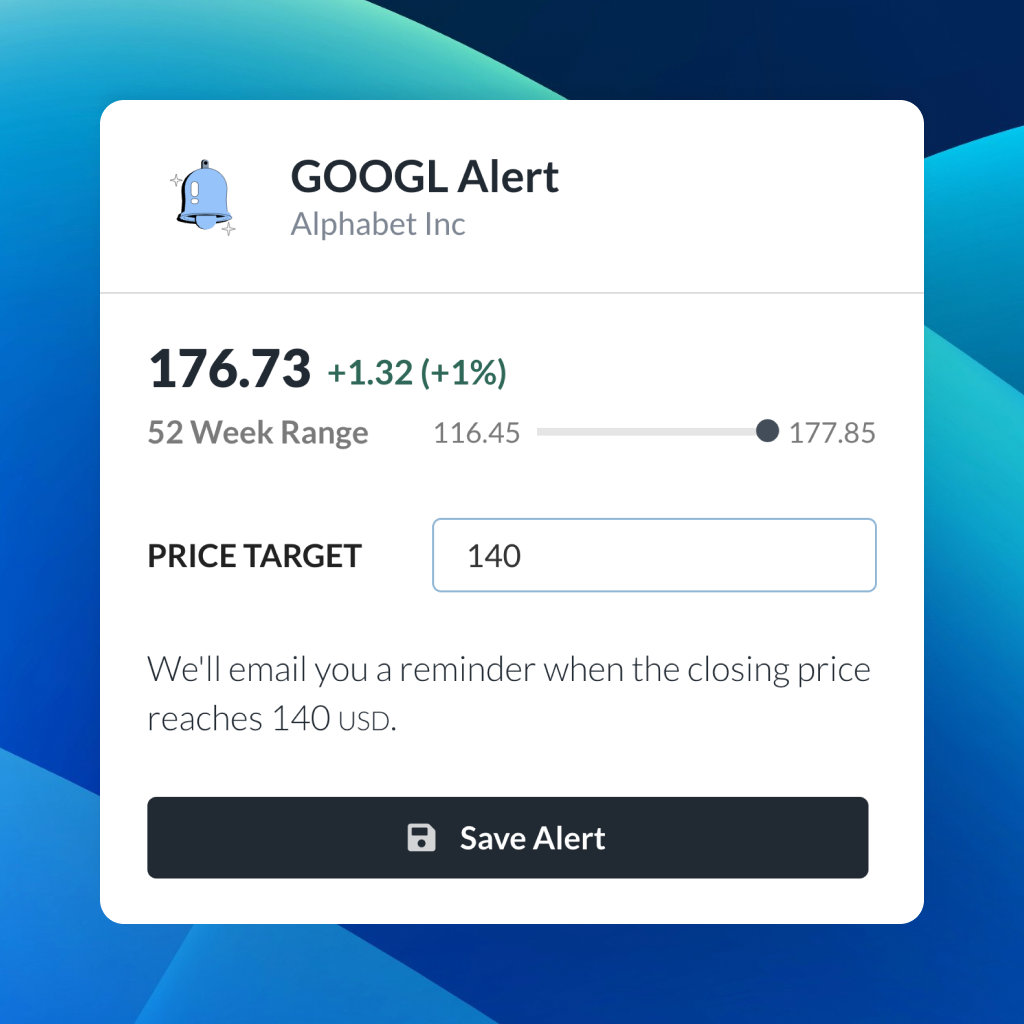
| Price Target |
|
We'll email you a reminder when the closing price reaches USD.
Choose the stock you wish to monitor with a price alert.
|
|
Johnson & Johnson
NYSE:JNJ
|
US |
|
|
Berkshire Hathaway Inc
NYSE:BRK.A
|
US |
|
|
Bank of America Corp
NYSE:BAC
|
US |
|
|
Mastercard Inc
NYSE:MA
|
US |
|
|
Abbvie Inc
NYSE:ABBV
|
US |
|
|
Pfizer Inc
NYSE:PFE
|
US |
|
|
Palantir Technologies Inc
NYSE:PLTR
|
US |
|
|
Nike Inc
NYSE:NKE
|
US |
|
|
Visa Inc
NYSE:V
|
US |
|
|
Alibaba Group Holding Ltd
NYSE:BABA
|
CN |
|
|
3M Co
NYSE:MMM
|
US |
|
|
JPMorgan Chase & Co
NYSE:JPM
|
US |
|
|
Coca-Cola Co
NYSE:KO
|
US |
|
|
Realty Income Corp
NYSE:O
|
US |
|
|
Walt Disney Co
NYSE:DIS
|
US |
|
|
PayPal Holdings Inc
NASDAQ:PYPL
|
US |
This alert will be permanently deleted.
Intrinsic Value
Garmin Ltd. is a holding company, which engages in the provision of navigation, communications and information devices, most of which are enabled by Global Positioning System (GPS) technology. [ Read More ]
The intrinsic value of one GRMN stock under the Base Case scenario is 114.26 USD. Compared to the current market price of 177.94 USD, Garmin Ltd is Overvalued by 36%.
Valuation Backtest
Garmin Ltd
Run backtest to discover the historical profit from buying and selling GRMN stocks based on their intrinsic value.
Analyze the historical link between intrinsic value and market price to make more informed investment decisions.
Fundamental Analysis
Garmin Achieves Record Q1 Revenue and Earnings Growth
Earnings Call Summary
In the first quarter of 2024, Garmin reported outstanding financial performance with a 20% increase in consolidated revenue to $1.38 billion, driven by strong growth across four business segments. Gross and operating margins improved year-over-year to 58.1% and 21.6%, respectively, leading to a 51% rise in operating income to $298 million. Pro forma EPS climbed 39% to $1.42. Significant growth was recorded in the fitness segment, where revenue surged 40%, and in the auto OEM segment with a 58% increase. Despite the strong start, Garmin maintained its previously issued guidance, mindful of Q1's typical seasonality.
Balance Sheet Decomposition
Garmin Ltd
| Current Assets | 4.5B |
| Cash & Short-Term Investments | 2.2B |
| Receivables | 694.7m |
| Other Current Assets | 1.6B |
| Non-Current Assets | 4.1B |
| Long-Term Investments | 1.1B |
| PP&E | 1.3B |
| Intangibles | 778.3m |
| Other Non-Current Assets | 861.7m |
| Current Liabilities | 1.1B |
| Accounts Payable | 243.1m |
| Accrued Liabilities | 517.1m |
| Other Current Liabilities | 357.2m |
| Non-Current Liabilities | 270.4m |
| Other Non-Current Liabilities | 270.4m |
Earnings Waterfall
Garmin Ltd
|
Revenue
|
5.5B
USD
|
|
Cost of Revenue
|
-2.3B
USD
|
|
Gross Profit
|
3.2B
USD
|
|
Operating Expenses
|
-2B
USD
|
|
Operating Income
|
1.2B
USD
|
|
Other Expenses
|
169.5m
USD
|
|
Net Income
|
1.4B
USD
|
Free Cash Flow Analysis
Garmin Ltd
| USD | |
| Free Cash Flow | USD |
GRMN Profitability Score
Profitability Due Diligence
Garmin Ltd's profitability score is 64/100. The higher the profitability score, the more profitable the company is.
Score
Garmin Ltd's profitability score is 64/100. The higher the profitability score, the more profitable the company is.
GRMN Solvency Score
Solvency Due Diligence
Garmin Ltd's solvency score is 81/100. The higher the solvency score, the more solvent the company is.
Score
Garmin Ltd's solvency score is 81/100. The higher the solvency score, the more solvent the company is.
Wall St
Price Targets
GRMN Price Targets Summary
Garmin Ltd
According to Wall Street analysts, the average 1-year price target for GRMN is 145.94 USD with a low forecast of 119.18 USD and a high forecast of 174.3 USD.

Ownership
GRMN Insider Trading
Buy and sell transactions by insiders
| Period | Sold | Bought | Net |
|---|---|---|---|
| 3 Months |
|
|
|
| 6 Months |
|
|
|
| 9 Months |
|
|
|
| 12 Months |
|
|
|
Price Appreciation
GRMN Price
Garmin Ltd
| Average Annual Return | 9.33% |
| Standard Deviation of Annual Returns | 25.3% |
| Max Drawdown | -38% |
| Market Capitalization | 34.2B USD |
| Shares Outstanding | 192 078 000 |
| Percentage of Shares Shorted | 1.48% |
Company Profile
Country
Industry
Market Cap
Dividend Yield
Description
Garmin Ltd. is a holding company, which engages in the provision of navigation, communications and information devices, most of which are enabled by Global Positioning System (GPS) technology. The company is headquartered in Schaffhausen, Schaffhausen and currently employs 18,700 full-time employees. The company went IPO on 2000-12-08. The firm operates through five segments. The company offers a range of auto navigation products, as well as a range of products and applications designed for the mobile GPS market. The company offers products to consumers around the world, including Outdoor Handhelds, Wearable Devices, Golf Devices, and Dog Tracking and Training/Pet Obedience Devices. The company offers a range of products designed for use in fitness and activity tracking. Garmin offers a range of products designed for use in fitness and activity tracking. Its aviation business segment is a provider of solutions to aircraft manufacturers, existing aircraft owners and operators, as well as military and government customers and serves a range of aircraft, including transport aircraft, business aviation, general aviation, experimental/light sport, helicopters, optionally piloted vehicles and unmanned aerial vehicles.
Contact
IPO
Employees
Officers
The intrinsic value of one GRMN stock under the Base Case scenario is 114.26 USD.
Compared to the current market price of 177.94 USD, Garmin Ltd is Overvalued by 36%.


 You don't have any saved screeners yet
