Tesla Inc
NASDAQ:TSLA

Decide at what price you'd be comfortable buying and we'll help you stay ready.

|
Johnson & Johnson
NYSE:JNJ
|
US |

|
Berkshire Hathaway Inc
NYSE:BRK.A
|
US |

|
Bank of America Corp
NYSE:BAC
|
US |

|
Mastercard Inc
NYSE:MA
|
US |

|
UnitedHealth Group Inc
NYSE:UNH
|
US |

|
Exxon Mobil Corp
NYSE:XOM
|
US |

|
Pfizer Inc
NYSE:PFE
|
US |

|
Nike Inc
NYSE:NKE
|
US |

|
Visa Inc
NYSE:V
|
US |

|
Alibaba Group Holding Ltd
NYSE:BABA
|
CN |

|
JPMorgan Chase & Co
NYSE:JPM
|
US |

|
Coca-Cola Co
NYSE:KO
|
US |

|
Verizon Communications Inc
NYSE:VZ
|
US |

|
Chevron Corp
NYSE:CVX
|
US |

|
Walt Disney Co
NYSE:DIS
|
US |

|
PayPal Holdings Inc
NASDAQ:PYPL
|
US |
 Tesla Inc
Net Income (Common)
Tesla Inc
Net Income (Common)
Tesla Inc
Net Income (Common) Peer Comparison
Competitors Analysis
Latest Figures & CAGR of Competitors
| Company | Net Income (Common) | CAGR 3Y | CAGR 5Y | CAGR 10Y | ||
|---|---|---|---|---|---|---|
|
|
Tesla Inc
NASDAQ:TSLA
|
Net Income (Common)
$3.9B
|
CAGR 3-Years
-31%
|
CAGR 5-Years
28%
|
CAGR 10-Years
N/A
|
|

|
General Motors Co
NYSE:GM
|
Net Income (Common)
$3.2B
|
CAGR 3-Years
-29%
|
CAGR 5-Years
-13%
|
CAGR 10-Years
-11%
|
|

|
Thor Industries Inc
NYSE:THO
|
Net Income (Common)
$300.4m
|
CAGR 3-Years
-28%
|
CAGR 5-Years
-5%
|
CAGR 10-Years
3%
|
|

|
Ford Motor Co
NYSE:F
|
Net Income (Common)
-$8.2B
|
CAGR 3-Years
-60%
|
CAGR 5-Years
-45%
|
CAGR 10-Years
N/A
|
|

|
Rivian Automotive Inc
NASDAQ:RIVN
|
Net Income (Common)
-$3.6B
|
CAGR 3-Years
19%
|
CAGR 5-Years
-29%
|
CAGR 10-Years
N/A
|
|

|
Lucid Group Inc
NASDAQ:LCID
|
Net Income (Common)
-$3.8B
|
CAGR 3-Years
-14%
|
CAGR 5-Years
-40%
|
CAGR 10-Years
N/A
|
|
Tesla Inc
Glance View
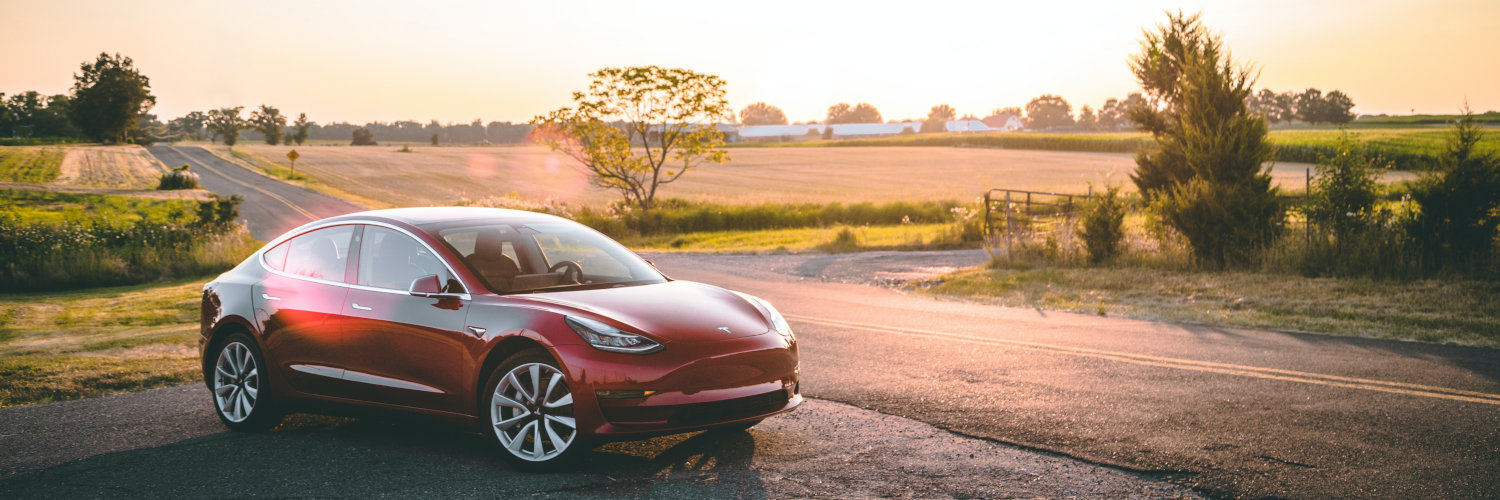
Tesla Inc., founded by Martin Eberhard and Marc Tarpenning in 2003 and later significantly shaped by Elon Musk, represents a transformative force in the automotive and energy sectors. What began as a niche startup, with an ambitious vision of creating electric cars accessible to the masses, has evolved into a multinational powerhouse. Tesla's key to success lies in its vertically integrated business model, which distinguishes it from traditional automakers. By keeping design, manufacturing, and even parts production largely in-house, Tesla not only reduces costs but also rapidly innovates. This model facilitates swift adaptation to new technological advancements and market demands, effectively condensing the typical automotive industry's lethargic timelines. Tesla's operations span across designing and producing electric vehicles—such as the Model S, Model 3, Model X, and Model Y—along with energy solutions including solar panels and energy storage products like the Powerwall and Powerpack. Tesla's financial engine is driven primarily by its automotive sales, but it bolsters this with diverse revenue streams. In addition to selling vehicles outright, they offer leasing options, yielding recurring revenue. Another cornerstone is their software prowess, particularly in autonomous driving technology and vehicle connectivity, which continually attracts consumer interest and corporate partnerships. Tesla's Supercharger network—comprising an extensive array of fast-charging stations—encourages EV adoption, adding another dimension to their integrated ecosystem. Meanwhile, in the energy sector, Tesla deploys its solar and storage solutions to both residential and commercial clients, capitalizing on the global shift towards renewable energy. This comprehensive approach not only positions Tesla as a leader in sustainable innovation but also fortifies its financial stability through diverse and complementary income sources.
See Also
What is Tesla Inc's Net Income (Common)?
Net Income (Common)
3.9B
USD
Based on the financial report for Mar 31, 2026, Tesla Inc's Net Income (Common) amounts to 3.9B USD.
What is Tesla Inc's Net Income (Common) growth rate?
Net Income (Common) CAGR 5Y
28%
Over the last year, the Net Income (Common) growth was -39%. The average annual Net Income (Common) growth rates for Tesla Inc have been -31% over the past three years , 28% over the past five years .
