Keppel Corporation Ltd
SGX:BN4

Decide at what price you'd be comfortable buying and we'll help you stay ready.

|
Johnson & Johnson
NYSE:JNJ
|
US |

|
Berkshire Hathaway Inc
NYSE:BRK.A
|
US |

|
Bank of America Corp
NYSE:BAC
|
US |

|
Mastercard Inc
NYSE:MA
|
US |

|
UnitedHealth Group Inc
NYSE:UNH
|
US |

|
Exxon Mobil Corp
NYSE:XOM
|
US |

|
Pfizer Inc
NYSE:PFE
|
US |

|
Nike Inc
NYSE:NKE
|
US |

|
Visa Inc
NYSE:V
|
US |

|
Alibaba Group Holding Ltd
NYSE:BABA
|
CN |

|
JPMorgan Chase & Co
NYSE:JPM
|
US |

|
Coca-Cola Co
NYSE:KO
|
US |

|
Verizon Communications Inc
NYSE:VZ
|
US |

|
Chevron Corp
NYSE:CVX
|
US |

|
Walt Disney Co
NYSE:DIS
|
US |

|
PayPal Holdings Inc
NASDAQ:PYPL
|
US |
P/OCF
Price to Operating Cash Flow (P/OCF) ratio compares a company`s market value to the cash it generates from its core operations.
Price to Operating Cash Flow (P/OCF) ratio compares a company`s market value to the cash it generates from its core operations.
Valuation Scenarios
If P/OCF returns to its 3-Year Average (43.4), the stock would be worth S$15.93 (45% upside from current price).
| Scenario | P/OCF Value | Implied Price | Upside/Downside |
|---|---|---|---|
| Current Multiple | 29.9 | S$10.99 |
0%
|
| 3-Year Average | 43.4 | S$15.93 |
+45%
|
| 5-Year Average | 42.2 | S$15.51 |
+41%
|
| Industry Average | 38.3 | S$14.08 |
+28%
|
| Country Average | 9.8 | S$3.61 |
-67%
|
Forward P/OCF
Today’s price vs future operating cash flow
Peer Comparison
| Market Cap | P/OCF | P/E | ||||
|---|---|---|---|---|---|---|
| SG |

|
Keppel Corporation Ltd
SGX:BN4
|
19.7B SGD | 29.9 | 25.1 | |
| US |

|
General Electric Co
NYSE:GE
|
296.9B USD | 34.1 | 34.9 | |
| DE |

|
Siemens AG
XETRA:SIE
|
196.1B EUR | 15.8 | 24.5 | |
| JP |

|
Hitachi Ltd
TSE:6501
|
22.8T JPY | 13.3 | 27.6 | |
| US |

|
Honeywell International Inc
NASDAQ:HON
|
134.4B USD | 26.2 | 29.9 | |
| ZA |
B
|
Bidvest Group Ltd
JSE:BVT
|
78.5B ZAR | 10.1 | 12.9 | |
| US |

|
3M Co
NYSE:MMM
|
76B USD | 26.2 | 27.3 | |
| CN |

|
CITIC Ltd
HKEX:267
|
377B HKD | 0 | 5.6 | |
| US |
R
|
Roper Technologies Inc
F:ROP
|
30.4B EUR | 14.4 | 21.8 | |
| KR |

|
Samsung C&T Corp
KRX:028260
|
51.1T KRW | 16.9 | 20.9 | |
| HK |

|
CK Hutchison Holdings Ltd
HKEX:1
|
247.8B HKD | 4 | 20.9 |
Market Distribution
| Min | 0 |
| 30th Percentile | 6.4 |
| Median | 9.8 |
| 70th Percentile | 15.7 |
| Max | 1 304.2 |
Other Multiples
Keppel Corporation Ltd
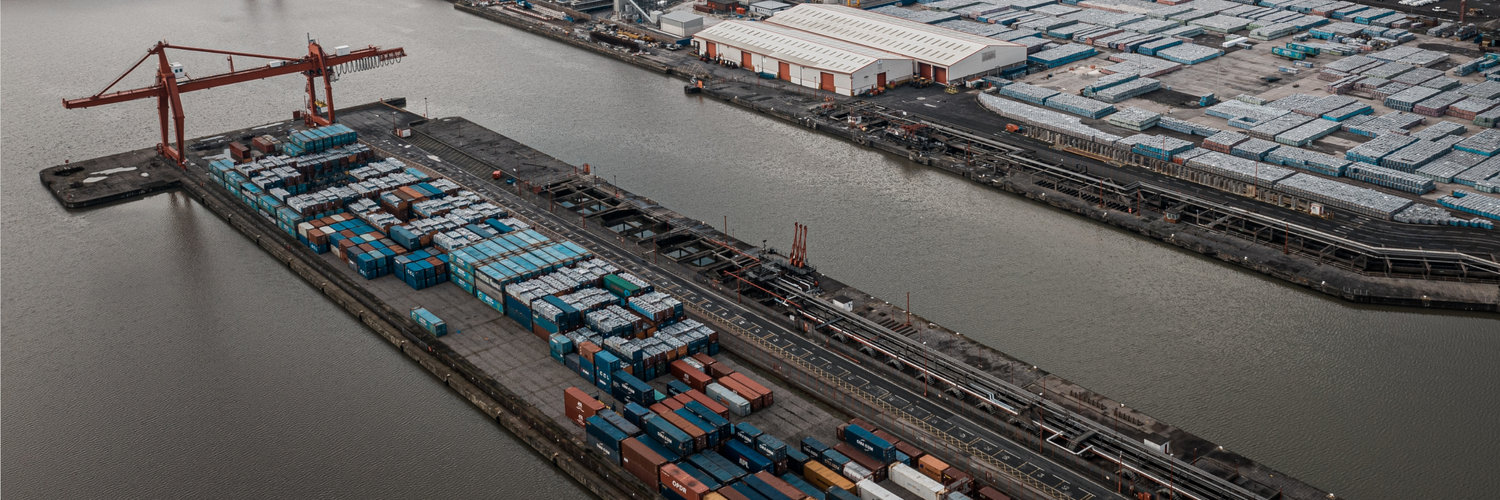
Glance View
Keppel Corporation Ltd., an illustrious titan in Singapore's business landscape, weaves its narrative through a diverse tapestry of operations. Founded in the shipyards over five decades ago, Keppel has impressively evolved, spreading its wings far beyond its maritime roots. Today, the company stands as a conglomerate juggernaut, effectively operating within four main spheres: offshore and marine, real estate, infrastructure, and investments. Each sector not only complements the other but also contributes robustly to the company's bottom line, demonstrating a strategic interplay of resources and expertise. Their real estate business, for example, thrives by developing and managing high-quality residential and commercial properties across Asia, ensuring a steady flow of revenue. Aligned with modern economic demands, Keppel's infrastructure division plays a pivotal role in sustainable urban solutions, from data centers to waste management. Meanwhile, their offshore and marine arm continues to innovate and deliver services in the construction and repair of rigs and vessels, although it has faced headwinds due to fluctuating oil prices. The investments sector strategically allocates capital to synergistic pursuits, fostering long-term growth. Through this multifaceted approach, Keppel Corporation not only captures value across diverse sectors but also exemplifies a dynamic business model that adeptly navigates the complexities of the global market.
