Karadanote Inc
TSE:4014

| US |

|
Johnson & Johnson
NYSE:JNJ
|
Pharmaceuticals
|
| US |

|
Berkshire Hathaway Inc
NYSE:BRK.A
|
Financial Services
|
| US |

|
Bank of America Corp
NYSE:BAC
|
Banking
|
| US |

|
Mastercard Inc
NYSE:MA
|
Technology
|
| US |

|
Abbvie Inc
NYSE:ABBV
|
Biotechnology
|
| US |

|
Pfizer Inc
NYSE:PFE
|
Pharmaceuticals
|
| US |

|
Palantir Technologies Inc
NYSE:PLTR
|
Technology
|
| US |

|
Nike Inc
NYSE:NKE
|
Textiles, Apparel & Luxury Goods
|
| US |

|
Visa Inc
NYSE:V
|
Technology
|
| CN |

|
Alibaba Group Holding Ltd
NYSE:BABA
|
Retail
|
| US |

|
3M Co
NYSE:MMM
|
Industrial Conglomerates
|
| US |

|
JPMorgan Chase & Co
NYSE:JPM
|
Banking
|
| US |

|
Coca-Cola Co
NYSE:KO
|
Beverages
|
| US |

|
Realty Income Corp
NYSE:O
|
Real Estate
|
| US |

|
Walt Disney Co
NYSE:DIS
|
Media
|
| US |

|
PayPal Holdings Inc
NASDAQ:PYPL
|
Technology
|

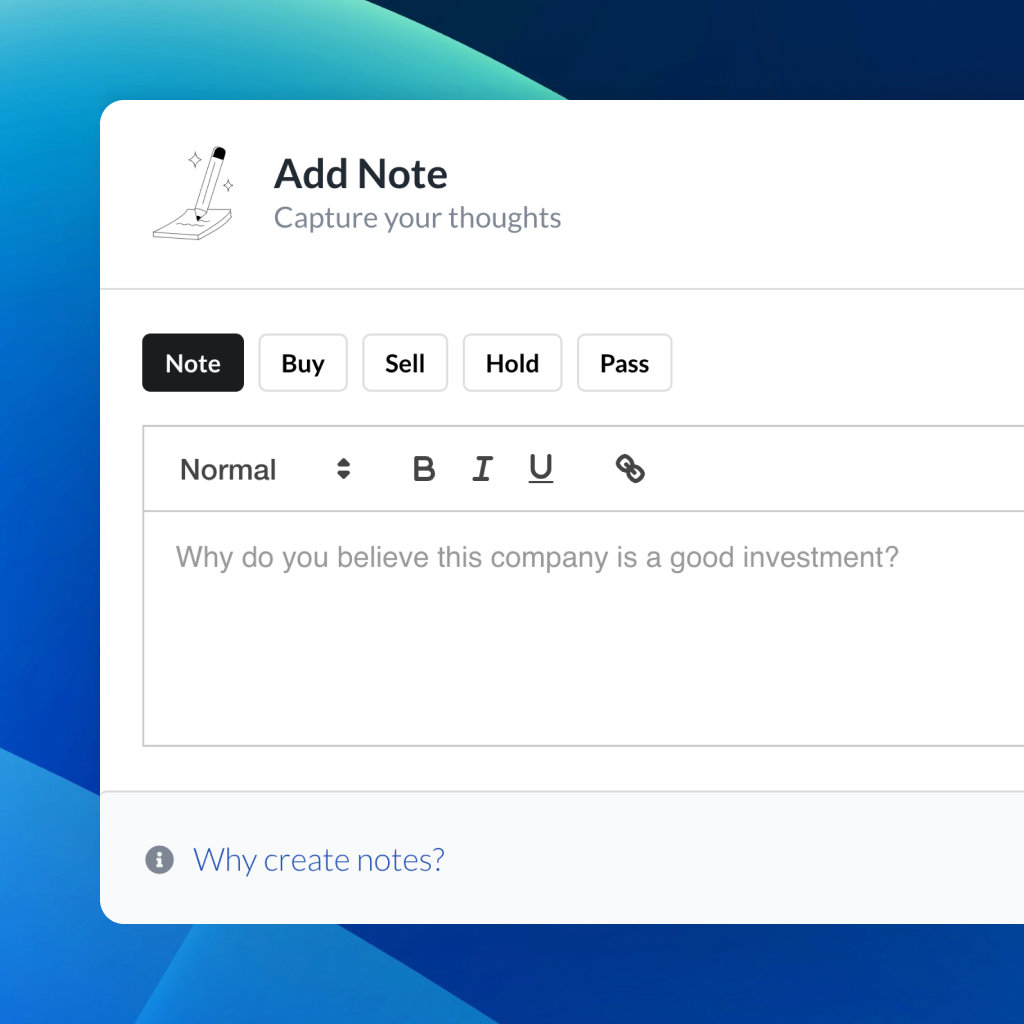
Utilize notes to systematically review your investment decisions. By reflecting on past outcomes, you can discern effective strategies and identify those that underperformed. This continuous feedback loop enables you to adapt and refine your approach, optimizing for future success.
Each note serves as a learning point, offering insights into your decision-making processes. Over time, you'll accumulate a personalized database of knowledge, enhancing your ability to make informed decisions quickly and effectively.
With a comprehensive record of your investment history at your fingertips, you can compare current opportunities against past experiences. This not only bolsters your confidence but also ensures that each decision is grounded in a well-documented rationale.
Do you really want to delete this note?
This action cannot be undone.

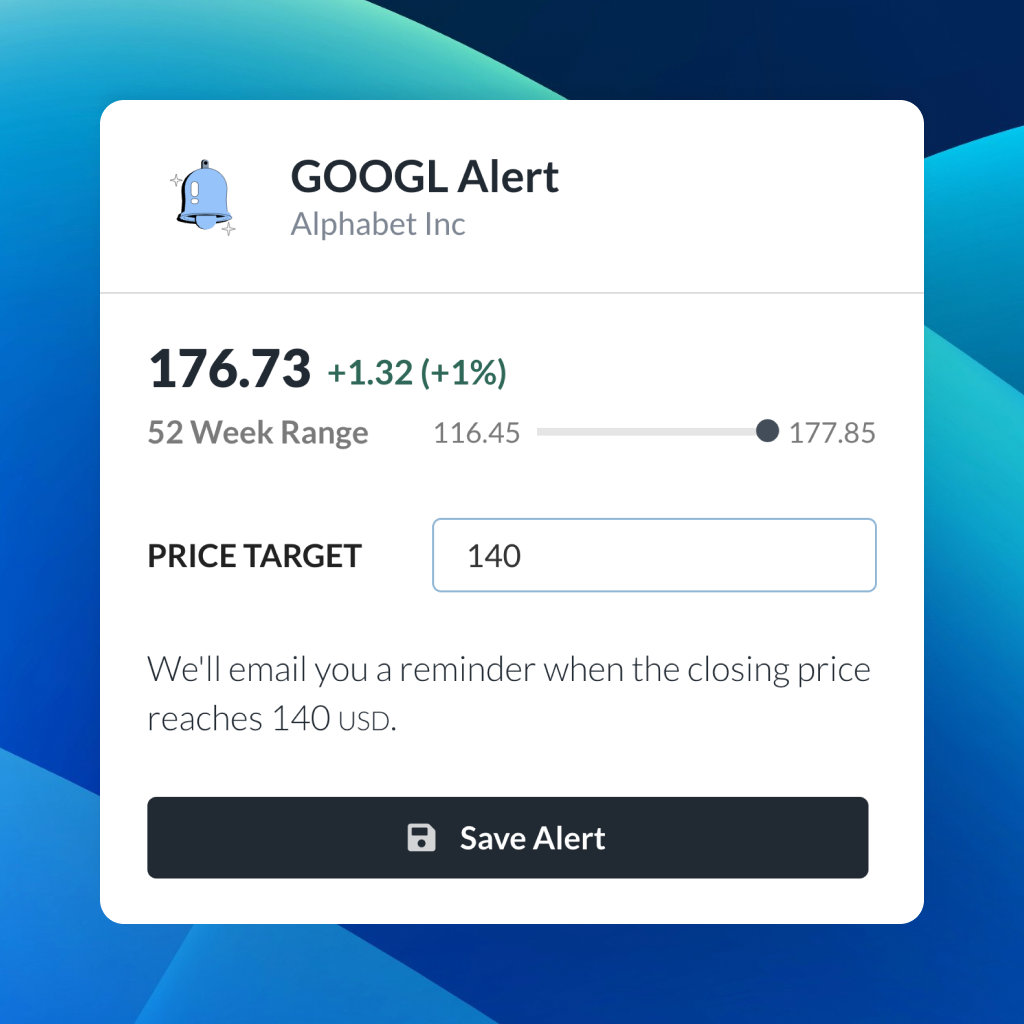
| 52 Week Range |
447
810
|
| Price Target |
|
We'll email you a reminder when the closing price reaches JPY.
Choose the stock you wish to monitor with a price alert.
|
|
Johnson & Johnson
NYSE:JNJ
|
US |
|
|
Berkshire Hathaway Inc
NYSE:BRK.A
|
US |
|
|
Bank of America Corp
NYSE:BAC
|
US |
|
|
Mastercard Inc
NYSE:MA
|
US |
|
|
Abbvie Inc
NYSE:ABBV
|
US |
|
|
Pfizer Inc
NYSE:PFE
|
US |
|
|
Palantir Technologies Inc
NYSE:PLTR
|
US |
|
|
Nike Inc
NYSE:NKE
|
US |
|
|
Visa Inc
NYSE:V
|
US |
|
|
Alibaba Group Holding Ltd
NYSE:BABA
|
CN |
|
|
3M Co
NYSE:MMM
|
US |
|
|
JPMorgan Chase & Co
NYSE:JPM
|
US |
|
|
Coca-Cola Co
NYSE:KO
|
US |
|
|
Realty Income Corp
NYSE:O
|
US |
|
|
Walt Disney Co
NYSE:DIS
|
US |
|
|
PayPal Holdings Inc
NASDAQ:PYPL
|
US |
This alert will be permanently deleted.
Intrinsic Value
Karadanote, Inc. engages in the family data platform business. [ Read More ]
The intrinsic value of one Karadanote Inc stock under the Base Case scenario is 814.43 JPY. Compared to the current market price of 538 JPY, Karadanote Inc is Undervalued by 34%.
Valuation Backtest
Karadanote Inc
Run backtest to discover the historical profit from buying and selling Karadanote Inc stocks based on their intrinsic value.
Analyze the historical link between intrinsic value and market price to make more informed investment decisions.
Fundamental Analysis
Balance Sheet Decomposition
Karadanote Inc
| Current Assets | 1.1B |
| Cash & Short-Term Investments | 473.8m |
| Receivables | 450.8m |
| Other Current Assets | 140.4m |
| Non-Current Assets | 45.6m |
| Other Non-Current Assets | 45.6m |
| Current Liabilities | 404.3m |
| Accounts Payable | 87.3m |
| Accrued Liabilities | 4.4m |
| Other Current Liabilities | 312.7m |
| Non-Current Liabilities | 255.2m |
| Long-Term Debt | 250m |
| Other Non-Current Liabilities | 5.2m |
Earnings Waterfall
Karadanote Inc
|
Revenue
|
2.2B
JPY
|
|
Cost of Revenue
|
-621.2m
JPY
|
|
Gross Profit
|
1.6B
JPY
|
|
Operating Expenses
|
-1.6B
JPY
|
|
Operating Income
|
15.4m
JPY
|
|
Other Expenses
|
-119.6m
JPY
|
|
Net Income
|
-104.2m
JPY
|
Free Cash Flow Analysis
Karadanote Inc
| JPY | |
| Free Cash Flow | JPY |
Profitability Score
Profitability Due Diligence
Karadanote Inc's profitability score is 30/100. The higher the profitability score, the more profitable the company is.
Score
Karadanote Inc's profitability score is 30/100. The higher the profitability score, the more profitable the company is.
Solvency Score
Solvency Due Diligence
Karadanote Inc's solvency score is 64/100. The higher the solvency score, the more solvent the company is.
Score
Karadanote Inc's solvency score is 64/100. The higher the solvency score, the more solvent the company is.
Wall St
Price Targets
Price Targets Summary
Karadanote Inc

Price Appreciation
Price
Karadanote Inc
| Average Annual Return | -19.25% |
| Standard Deviation of Annual Returns | 30.84% |
| Max Drawdown | -79% |
| Market Capitalization | 3.4B JPY |
| Shares Outstanding | 6 454 900 |
| Percentage of Shares Shorted |
N/A
|
Company Profile
Country
Industry
Market Cap
Dividend Yield
Description
Karadanote, Inc. engages in the family data platform business. The company is headquartered in Minato-Ku, Tokyo-To and currently employs 40 full-time employees. The company went IPO on 2020-10-27. The Company’s business flow is mainly targeted at pregnant and child-rearing moms and leads to a campaign page with a questionnaire where you can get gifts when you apply through in-house content or external advertisements, including the living conditions. The firm stores personal information as personal data and store it. Based on the accumulated personal data, it recommends services that meet the needs of users, provides personal data that matches the services provided by companies, supports family decision making, and improves the efficiency of corporate marketing. Main application include Mama Biyori as information provision content for pre-mama, Jintsu Kitakamo as a labor interval measurement tool, Breastfeeding Note as a breastfeeding record management tool, Step baby food as a baby food management tool, and Vaccine Note as a vaccination management tool.
Contact
IPO
Employees
Officers
The intrinsic value of one Karadanote Inc stock under the Base Case scenario is 814.43 JPY.
Compared to the current market price of 538 JPY, Karadanote Inc is Undervalued by 34%.

 You don't have any saved screeners yet
