
Hirata Corp
TSE:6258

Decide at what price you'd be comfortable buying and we'll help you stay ready.

|
Johnson & Johnson
NYSE:JNJ
|
US |

|
Berkshire Hathaway Inc
NYSE:BRK.A
|
US |

|
Bank of America Corp
NYSE:BAC
|
US |

|
Mastercard Inc
NYSE:MA
|
US |

|
UnitedHealth Group Inc
NYSE:UNH
|
US |

|
Exxon Mobil Corp
NYSE:XOM
|
US |

|
Pfizer Inc
NYSE:PFE
|
US |

|
Nike Inc
NYSE:NKE
|
US |

|
Visa Inc
NYSE:V
|
US |

|
Alibaba Group Holding Ltd
NYSE:BABA
|
CN |

|
JPMorgan Chase & Co
NYSE:JPM
|
US |

|
Coca-Cola Co
NYSE:KO
|
US |

|
Verizon Communications Inc
NYSE:VZ
|
US |

|
Chevron Corp
NYSE:CVX
|
US |

|
Walt Disney Co
NYSE:DIS
|
US |

|
PayPal Holdings Inc
NASDAQ:PYPL
|
US |
EV/GP
Enterprise Value to Gross Profit (EV/GP) ratio compares a company`s total enterprise value to its gross profit. It shows how much investors are paying for each dollar of the company`s gross profit, including both equity and debt.
Enterprise Value to Gross Profit (EV/GP) ratio compares a company`s total enterprise value to its gross profit. It shows how much investors are paying for each dollar of the company`s gross profit, including both equity and debt.
Valuation Scenarios
If EV/GP returns to its 3-Year Average (4.3), the stock would be worth ¥3 065.78 (6% downside from current price).
| Scenario | EV/GP Value | Implied Price | Upside/Downside |
|---|---|---|---|
| Current Multiple | 4.6 | ¥3 245 |
0%
|
| 3-Year Average | 4.3 | ¥3 065.78 |
-6%
|
| 5-Year Average | 4.4 | ¥3 142.99 |
-3%
|
| Industry Average | 3.8 | ¥2 724.83 |
-16%
|
| Country Average | 3.7 | ¥2 664.55 |
-18%
|
Forward EV/GP
Today’s price vs future gross profit
Peer Comparison
| Market Cap | EV/GP | P/E | ||||
|---|---|---|---|---|---|---|
| JP |
|
Hirata Corp
TSE:6258
|
99.4B JPY | 4.6 | 15.2 | |
| JP |
F
|
Fujitec Co Ltd
TSE:6406
|
2 720 795.8T JPY | 5.6 | 0 | |
| JP |
I
|
Ishii Iron Works Co Ltd
TSE:6362
|
304.2T JPY | 101 236.7 | 363 670.8 | |
| JP |
S
|
Star Micronics Co Ltd
TSE:7718
|
48T JPY | 2.6 | 29.8 | |
| US |

|
Parker-Hannifin Corp
NYSE:PH
|
114.8B USD | 15.5 | 31.5 | |
| JP |

|
Freund Corp
TSE:6312
|
16.9T JPY | 1 767.7 | 8 494.3 | |
| JP |

|
Mitsubishi Heavy Industries Ltd
TSE:7011
|
15.4T JPY | 15.4 | 54.9 | |
| SE |

|
Atlas Copco AB
STO:ATCO A
|
848.5B SEK | 11.9 | 32.1 | |
| US |

|
Illinois Tool Works Inc
NYSE:ITW
|
74.5B USD | 11.3 | 24 | |
| US |

|
Barnes Group Inc
NYSE:B
|
65.9B USD | 7.2 | 13 | |
| SE |

|
Sandvik AB
STO:SAND
|
480.6B SEK | 10.4 | 32.4 |
Market Distribution
| Min | 0.1 |
| 30th Percentile | 2.6 |
| Median | 3.7 |
| 70th Percentile | 5.9 |
| Max | 45 735 393.8 |
Other Multiples
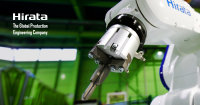
Hirata Corp
Glance View
Hirata Corp. engages in the manufacture and sale of manufacturing line systems, industrial robots, and logistics equipment. The company is headquartered in Kumamoto-Shi, Kumamoto-Ken and currently employs 1,862 full-time employees. The company went IPO on 2006-12-14. The firm operates in four segments, including Japan, Asia, North America and Europe. The automobile-related manufacturing equipment business mainly provides automated assembly lines of various automobile parts, such as engines, transmissions and other in-vehicle electronic parts. The semiconductor-related manufacturing equipment business provides silicon wafer transfer equipment used in semiconductor manufacturing processes, as well as the manufacturing equipment for flat panel displays (FPDs). The home appliance-related and other manufacturing equipment business provides manufacturing equipment for home appliances, as well as logistics-related equipment including stockers and transportation equipment.
