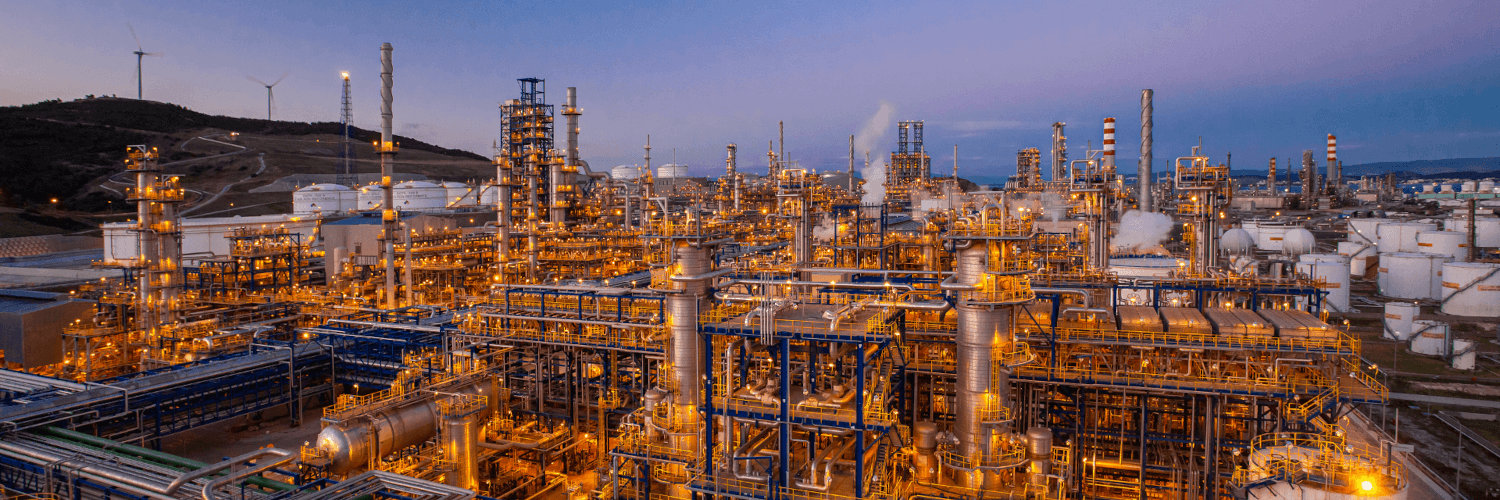

Turkiye Petrol Rafinerileri AS
IST:TUPRS.E

Decide at what price you'd be comfortable buying and we'll help you stay ready.

|
Turkiye Petrol Rafinerileri AS
IST:TUPRS.E
|
TR |

|
Thai Beverage PCL
SGX:Y92
|
TH |
|
B
|
BGT Corporation PCL
SET:BGT
|
TH |
|
N
|
Noah Holdings Ltd
HKEX:6686
|
CN |

|
Marketingforce Management Ltd
HKEX:2556
|
CN |
|
R
|
Revolver Resources Holdings Ltd
ASX:RRR
|
AU |
Profitability Summary
Turkiye Petrol Rafinerileri AS's profitability score is hidden . We take all the information about a company's profitability (such as its margins, capital efficiency, free cash flow generating ability, and more) and consolidate it into one single number - the profitability score. The higher the profitability score, the more profitable the company is.
Profitability Score
We take all the information about a company's profitability (such as its margins, capital efficiency, free cash flow generating ability, and more) and consolidate it into one single number - the profitability score. The higher the profitability score, the more profitable the company is.
We take all the information about a company's profitability (such as its margins, capital efficiency, free cash flow generating ability, and more) and consolidate it into one single number - the profitability score. The higher the profitability score, the more profitable the company is.
Profitability Score
Margins
Earnings Waterfall
Turkiye Petrol Rafinerileri AS
Margins Comparison
Turkiye Petrol Rafinerileri AS Competitors
| Country | Company | Market Cap |
Gross Margin |
Operating Margin |
Net Margin |
||
|---|---|---|---|---|---|---|---|
| TR |
|
Turkiye Petrol Rafinerileri AS
IST:TUPRS.E
|
493.3B TRY |
Loading...
|
Loading...
|
Loading...
|
|
| JP |

|
Fuji Oil Co Ltd
F:ACK
|
77.2T EUR |
Loading...
|
Loading...
|
Loading...
|
|
| IN |

|
Reliance Industries Ltd
NSE:RELIANCE
|
18.3T INR |
Loading...
|
Loading...
|
Loading...
|
|
| US |

|
Valero Energy Corp
NYSE:VLO
|
73B USD |
Loading...
|
Loading...
|
Loading...
|
|
| US |

|
Marathon Petroleum Corp
NYSE:MPC
|
71.3B USD |
Loading...
|
Loading...
|
Loading...
|
|
| US |

|
Phillips 66
NYSE:PSX
|
70.7B USD |
Loading...
|
Loading...
|
Loading...
|
|
| PL |

|
Polski Koncern Naftowy Orlen SA
WSE:PKN
|
155.5B PLN |
Loading...
|
Loading...
|
Loading...
|
|
| PL |
O
|
Orlen SA
PSE:PKN
|
876.5B CZK |
Loading...
|
Loading...
|
Loading...
|
|
| JP |

|
ENEOS Holdings Inc
TSE:5020
|
3.9T JPY |
Loading...
|
Loading...
|
Loading...
|
|
| FI |

|
Neste Oyj
OMXH:NESTE
|
20.9B EUR |
Loading...
|
Loading...
|
Loading...
|
|
| IN |

|
Indian Oil Corporation Ltd
NSE:IOC
|
1.8T INR |
Loading...
|
Loading...
|
Loading...
|
Return on Capital
Return on Capital Comparison
Turkiye Petrol Rafinerileri AS Competitors
| Country | Company | Market Cap | ROE | ROA | ROCE | ROIC | ||
|---|---|---|---|---|---|---|---|---|
| TR |
|
Turkiye Petrol Rafinerileri AS
IST:TUPRS.E
|
493.3B TRY |
Loading...
|
Loading...
|
Loading...
|
Loading...
|
|
| JP |
|
Fuji Oil Co Ltd
F:ACK
|
77.2T EUR |
Loading...
|
Loading...
|
Loading...
|
Loading...
|
|
| IN |
|
Reliance Industries Ltd
NSE:RELIANCE
|
18.3T INR |
Loading...
|
Loading...
|
Loading...
|
Loading...
|
|
| US |
|
Valero Energy Corp
NYSE:VLO
|
73B USD |
Loading...
|
Loading...
|
Loading...
|
Loading...
|
|
| US |
|
Marathon Petroleum Corp
NYSE:MPC
|
71.3B USD |
Loading...
|
Loading...
|
Loading...
|
Loading...
|
|
| US |
|
Phillips 66
NYSE:PSX
|
70.7B USD |
Loading...
|
Loading...
|
Loading...
|
Loading...
|
|
| PL |
|
Polski Koncern Naftowy Orlen SA
WSE:PKN
|
155.5B PLN |
Loading...
|
Loading...
|
Loading...
|
Loading...
|
|
| PL |
O
|
Orlen SA
PSE:PKN
|
876.5B CZK |
Loading...
|
Loading...
|
Loading...
|
Loading...
|
|
| JP |
|
ENEOS Holdings Inc
TSE:5020
|
3.9T JPY |
Loading...
|
Loading...
|
Loading...
|
Loading...
|
|
| FI |
|
Neste Oyj
OMXH:NESTE
|
20.9B EUR |
Loading...
|
Loading...
|
Loading...
|
Loading...
|
|
| IN |
|
Indian Oil Corporation Ltd
NSE:IOC
|
1.8T INR |
Loading...
|
Loading...
|
Loading...
|
Loading...
|
