
Reckitt Benckiser Group PLC
LSE:RKT

Decide at what price you'd be comfortable buying and we'll help you stay ready.

|
Johnson & Johnson
NYSE:JNJ
|
US |

|
Berkshire Hathaway Inc
NYSE:BRK.A
|
US |

|
Bank of America Corp
NYSE:BAC
|
US |

|
Mastercard Inc
NYSE:MA
|
US |

|
UnitedHealth Group Inc
NYSE:UNH
|
US |

|
Exxon Mobil Corp
NYSE:XOM
|
US |

|
Pfizer Inc
NYSE:PFE
|
US |

|
Nike Inc
NYSE:NKE
|
US |

|
Visa Inc
NYSE:V
|
US |

|
Alibaba Group Holding Ltd
NYSE:BABA
|
CN |

|
JPMorgan Chase & Co
NYSE:JPM
|
US |

|
Coca-Cola Co
NYSE:KO
|
US |

|
Verizon Communications Inc
NYSE:VZ
|
US |

|
Chevron Corp
NYSE:CVX
|
US |

|
Walt Disney Co
NYSE:DIS
|
US |

|
PayPal Holdings Inc
NASDAQ:PYPL
|
US |
P/E
Price to Earnings (P/E) ratio shows how much investors pay for each dollar of a company`s earnings. It`s calculated by dividing the company`s market value by its total earnings.
Price to Earnings (P/E) ratio shows how much investors pay for each dollar of a company`s earnings. It`s calculated by dividing the company`s market value by its total earnings.
Valuation Scenarios
If P/E returns to its 3-Year Average (17.6), the stock would be worth GBX8 604.47 (84% upside from current price).
| Scenario | P/E Value | Implied Price | Upside/Downside |
|---|---|---|---|
| Current Multiple | 9.6 | GBX4 678 |
0%
|
| 3-Year Average | 17.6 | GBX8 604.47 |
+84%
|
| 5-Year Average | 16.2 | GBX7 925.69 |
+69%
|
| Industry Average | 0.2 | GBX111.52 |
-98%
|
| Country Average | 0.2 | GBX101.5 |
-98%
|
Forward P/E
Today’s price vs future net income
| Today's Market Cap | Net Income | Forward P/E | ||
|---|---|---|---|---|
|
GBX33.8B
|
/ |
Jan 2026
£3.2B
|
= |
|
|
GBX33.8B
|
/ |
Dec 2026
£2.3B
|
= |
|
|
GBX33.8B
|
/ |
Dec 2027
£2.5B
|
= |
|
|
GBX33.8B
|
/ |
Dec 2028
£2.6B
|
= |
|
|
GBX33.8B
|
/ |
Dec 2029
£2.8B
|
= |
|
|
GBX33.8B
|
/ |
Dec 2030
£3.1B
|
= |
|
Forward P/E shows whether today’s P/E still looks high or low once future net income are taken into account.
Peer Comparison
| Market Cap | P/E | ||||
|---|---|---|---|---|---|
| UK |

|
Reckitt Benckiser Group PLC
LSE:RKT
|
30.5B GBP | 9.6 | |
| US |

|
Procter & Gamble Co
NYSE:PG
|
341.8B USD | 21.2 | |
| US |

|
Colgate-Palmolive Co
NYSE:CL
|
68.4B USD | 32.1 | |
| US |

|
Kimberly-Clark Corp
NYSE:KMB
|
32.7B USD | 15.4 | |
| DE |

|
Henkel AG & Co KGaA
XETRA:HEN3
|
25.3B EUR | 12.4 | |
| US |

|
Church & Dwight Co Inc
NYSE:CHD
|
23B USD | 31.2 | |
| SE |

|
Essity AB (publ)
STO:ESSITY B
|
167B SEK | 13.4 | |
| US |

|
Clorox Co
NYSE:CLX
|
11.7B USD | 15.4 | |
| JP |

|
Unicharm Corp
TSE:8113
|
1.6T JPY | 24.4 | |
| MX |

|
Kimberly-Clark de Mexico SAB de CV
BMV:KIMBERA
|
116.7B MXN | 15.4 | |
| US |

|
Reynolds Consumer Products Inc
NASDAQ:REYN
|
4.4B USD | 14.7 |
Market Distribution
| Min | 0 |
| 30th Percentile | 0.1 |
| Median | 0.2 |
| 70th Percentile | 0.3 |
| Max | 828.3 |
Other Multiples
Reckitt Benckiser Group PLC
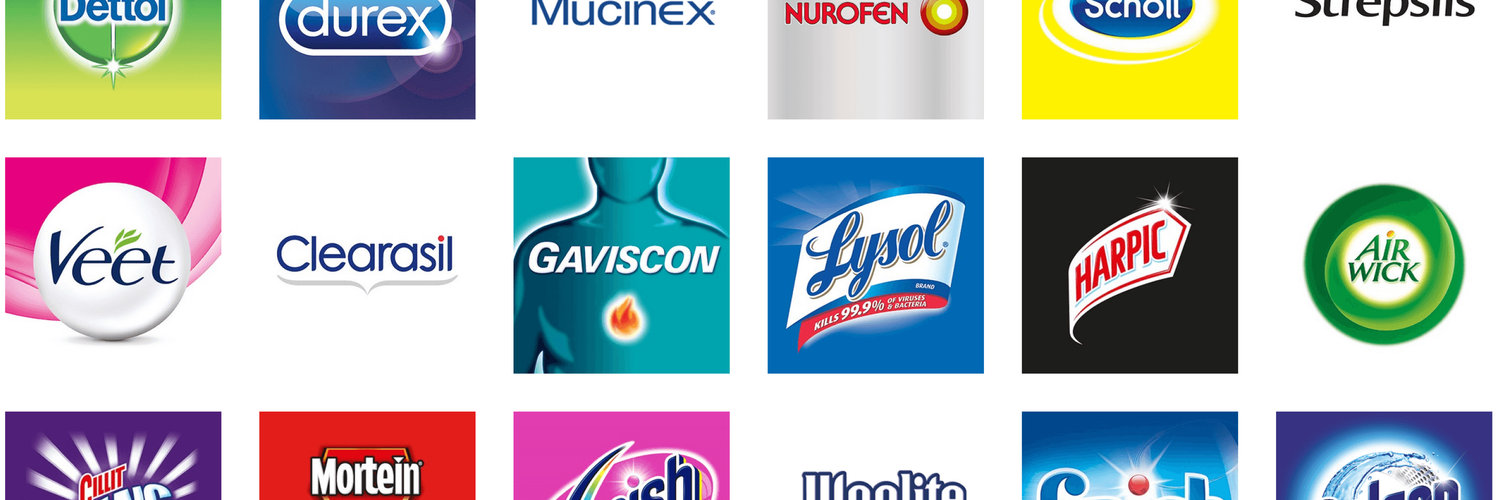
Glance View
In the dynamic world of consumer goods, Reckitt Benckiser Group PLC stands as a compelling narrative of innovation and resilience. Emerging as a fusion of Reckitt & Colman and Benckiser in 1999, this British multinational charts its course through the delightfully complex landscape of health, hygiene, and home products. The company's success hinges on its steadfast commitment to relentless product innovation and strong branding, with household names like Lysol, Dettol, and Durex under its wing. These brands are not just products on a shelf; they are icons of consumer trust, built on decades of consistent quality and strategic marketing that adapts to shifting consumer habits. Reckitt's ingenuity lies in its ability to weave scientific research and consumer insights into the fabric of its operations, ensuring it remains relevant in an ever-evolving market. Capitalizing on its diverse portfolio, Reckitt Benckiser's financial engine is fueled by a robust global distribution network and savvy market segmentation. The company adeptly navigates the complexities of various channels, from brick-and-mortar retailers to e-commerce platforms, ensuring its products become household staples worldwide. Its revenue streams are bolstered by tapping into the perennial demand for health and hygiene solutions—an area experiencing heightened attention, particularly in the wake of global health challenges. The strategic balance of premium and value-oriented offerings allows Reckitt to cater to diverse consumer preferences and purchasing powers across different regions. Through a meticulous blend of brand strength, innovative prowess, and global reach, Reckitt Benckiser continues to cement its position as a formidable player in the consumer goods arena.
