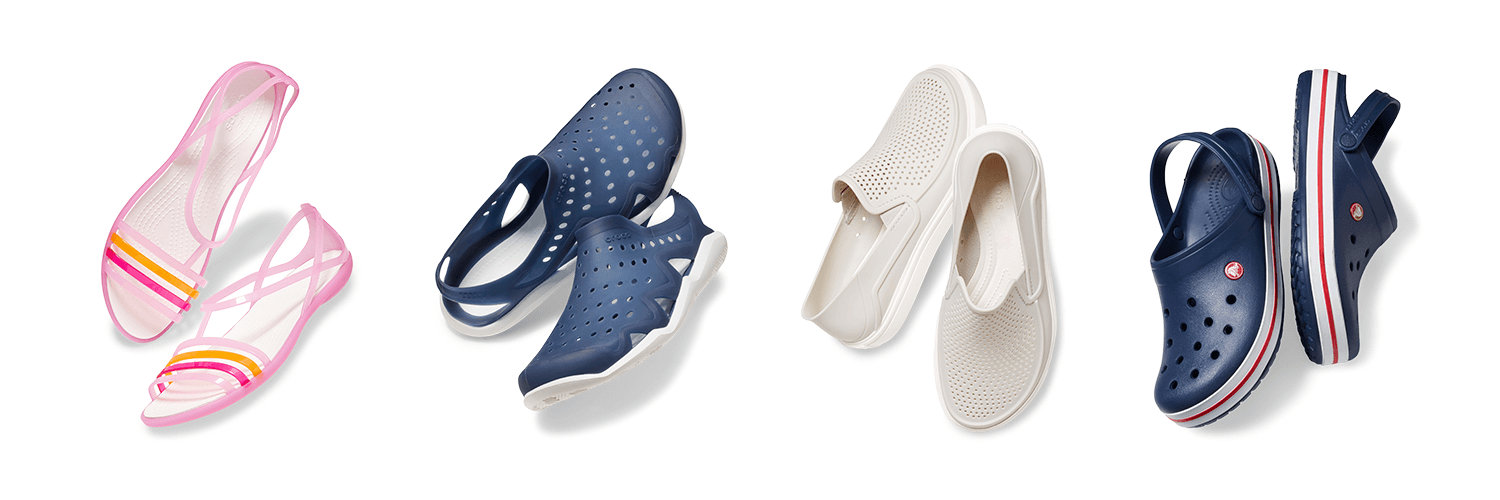
Crocs Inc
NASDAQ:CROX

Watchlist Manager
Crocs Inc Logo
Crocs Inc
NASDAQ:CROX
Watchlist
Price: 89.7 USD 1.65% Market Closed
Market Cap: 4.7B USD

Profitability Summary

Crocs Inc's profitability score is hidden . We take all the information about a company's profitability (such as its margins, capital efficiency, free cash flow generating ability, and more) and consolidate it into one single number - the profitability score. The higher the profitability score, the more profitable the company is.

Sign Up to see
Profitability Score
Sign In
Sign Up

We take all the information about a company's profitability (such as its margins, capital efficiency, free cash flow generating ability, and more) and consolidate it into one single number - the profitability score. The higher the profitability score, the more profitable the company is.

Past Growth

Analyzing past growth in Revenue, Operating Income, and Net Income allows investors to assess the company's profitability and operational efficiency. Consistent improvement in these metrics typically signals long-term strength and stability.

Show More Less

Margins

Profit margins represent what percentage of sales has turned into profits. Simply put, the percentage figure indicates how many cents of profit the company has generated for each dollar of sale.

Profit margins help investors assess if a company's management is generating enough profit from its sales and whether operating costs and overhead costs are being contained.

Show More Less

Earnings Waterfall
Crocs Inc

Revenue
4.1B USD
Cost of Revenue
-1.7B USD
Gross Profit
2.4B USD
Operating Expenses
-1.5B USD
Operating Income
941.1m USD
Other Expenses
-758.6m USD
Net Income
182.5m USD

Margins Comparison
Crocs Inc Competitors

Country Company Market Cap Gross
Margin
Operating
Margin
Net
Margin
US
Crocs Inc
NASDAQ:CROX
4.7B USD
59%
23%
4%
US
Nike Inc
NYSE:NKE
97.3B USD
42%
7%
6%
JP
Asics Corp
TSE:7936
2.7T JPY
56%
17%
10%
CH
On Holding AG
NYSE:ONON
15.7B USD
62%
12%
8%
US
Deckers Outdoor Corp
NYSE:DECK
14.6B USD
58%
24%
19%
CN
Huali Industrial Group Co Ltd
SZSE:300979
68.7B CNY
22%
17%
14%
US
Skechers USA Inc
NYSE:SKX
9.5B USD
53%
9%
7%
UK
Birkenstock Holding PLC
NYSE:BIRK
8.1B USD
59%
26%
15%
TW
Feng Tay Enterprises Co Ltd
TWSE:9910
122.9B TWD
23%
9%
6%
DE
Puma SE
XETRA:PUM
3.1B EUR
47%
5%
-1%
HK
Yue Yuen Industrial (Holdings) Ltd
HKEX:551
25.9B HKD
24%
6%
4%
No Stocks Found

Return on Capital

Return on capital ratios give a sense of how well a company is using its capital (equity, assets, capital employed, etc.) to generate profits (operating income, net income, etc.). In simple words, these ratios show how much income is generated for each dollar of capital invested.

Show More Less

Return on Capital Comparison
Crocs Inc Competitors

Country Company Market Cap ROE ROA ROCE ROIC
US
Crocs Inc
NASDAQ:CROX
4.7B USD
12%
4%
25%
35%
US
Nike Inc
NYSE:NKE
97.3B USD
21%
8%
13%
12%
JP
Asics Corp
TSE:7936
2.7T JPY
31%
14%
35%
22%
CH
On Holding AG
NYSE:ONON
15.7B USD
17%
10%
20%
26%
US
Deckers Outdoor Corp
NYSE:DECK
14.6B USD
43%
28%
46%
56%
CN
Huali Industrial Group Co Ltd
SZSE:300979
68.7B CNY
21%
15%
26%
26%
US
Skechers USA Inc
NYSE:SKX
9.5B USD
15%
8%
13%
12%
UK
Birkenstock Holding PLC
NYSE:BIRK
8.1B USD
12%
6%
12%
8%
TW
Feng Tay Enterprises Co Ltd
TWSE:9910
122.9B TWD
22%
10%
23%
12%
DE
Puma SE
XETRA:PUM
3.1B EUR
-4%
-1%
11%
-3%
HK
Yue Yuen Industrial (Holdings) Ltd
HKEX:551
25.9B HKD
8%
5%
9%
7%
No Stocks Found

Free Cash Flow

Free cash flow (FCF) is the money a company has left over after paying its operating expenses and capital expenditures. The more free cash flow a company has, the more it can allocate to dividends, paying down debt, and growth opportunities.

If a company has a decreasing free cash flow, that is not necessarily bad if the company is investing in its growth.

Show More Less