Cal-Maine Foods Inc
F:CM2
Gross Margin
Gross Margin shows how much money a company keeps from each dollar of sales after paying for the products it sells. It tells how profitable the company`s core business is before other expenses.
Gross Margin shows how much money a company keeps from each dollar of sales after paying for the products it sells. It tells how profitable the company`s core business is before other expenses.
Peer Comparison
| Country | Company | Market Cap |
Gross Margin |
||
|---|---|---|---|---|---|
| US |
|
Cal-Maine Foods Inc
NASDAQ:CALM
|
4B USD |
Loading...
|
|
| JP |
G
|
Goyo Foods Industry Co Ltd
TSE:2230
|
53.2T JPY |
Loading...
|
|
| CH |

|
Nestle SA
SIX:NESN
|
199.8B CHF |
Loading...
|
|
| US |

|
Mondelez International Inc
NASDAQ:MDLZ
|
77.5B USD |
Loading...
|
|
| ZA |
T
|
Tiger Brands Ltd
JSE:TBS
|
57.1B ZAR |
Loading...
|
|
| FR |

|
Danone SA
PAR:BN
|
44.5B EUR |
Loading...
|
|
| US |

|
Hershey Co
NYSE:HSY
|
46.8B USD |
Loading...
|
|
| CN |

|
Muyuan Foods Co Ltd
SZSE:002714
|
255.1B CNY |
Loading...
|
|
| ZA |
A
|
Avi Ltd
JSE:AVI
|
36.3B ZAR |
Loading...
|
|
| CH |

|
Chocoladefabriken Lindt & Spruengli AG
SIX:LISN
|
27.4B CHF |
Loading...
|
|
| CN |

|
Foshan Haitian Flavouring and Food Co Ltd
SSE:603288
|
218B CNY |
Loading...
|
Market Distribution
| Min | -24 813% |
| 30th Percentile | 28.9% |
| Median | 43% |
| 70th Percentile | 60.5% |
| Max | 10 905 714.3% |
Other Profitability Ratios
Cal-Maine Foods Inc
Glance View
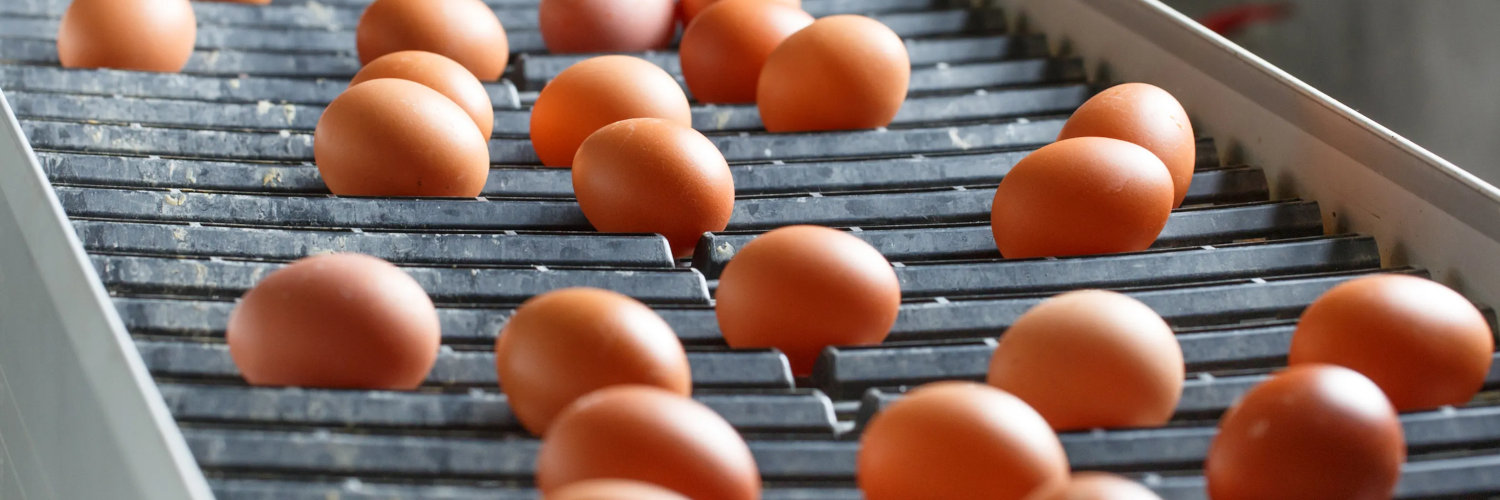
Cal-Maine Foods Inc., the dominant egg supplier in the United States, traces its roots back to 1957, nurturing its growth from a humble Mississippi operation into a sprawling empire. At the heart of Cal-Maine's success lies its vertically integrated business model, a concept that not only ensures efficiency but also insulates the company from many of the market fluctuations that typically buffet the agricultural sector. By maintaining control over virtually every stage of production—from the poultry breeding and grain milling processes to the distribution of the final egg products—Cal-Maine has crafted an enterprise that is as resilient as it is expansive. The company's operations span across the nation, supported by a vast network of production and processing facilities that handle millions of eggs daily. The egg business, while seemingly simple, requires navigating a web of variables —from feed costs and hen management to consumer demand and pricing strategies. Cal-Maine generates revenue by selling shell eggs primarily to grocery chains, club stores, and food-service distributors under both private-label and recognized brand names like Egg-Land's Best and Land O’ Lakes. To enhance profitability, the company has placed significant emphasis on specialty eggs, including nutritionally enhanced, cage-free, and organic options, which command higher margins. This focus responds to shifting consumer preferences towards healthier and ethically sourced food options. Cal-Maine's story is one of strategic adaptability, leveraging economies of scale and embracing market trends to sustain its lead in a competitive, ever-evolving market.
See Also
Gross Margin is calculated by dividing the Gross Profit by the Revenue.
The current Gross Margin for Cal-Maine Foods Inc is 41.9%, which is above its 3-year median of 34.8%.
Over the last 3 years, Cal-Maine Foods Inc’s Gross Margin has increased from 32.6% to 41.9%. During this period, it reached a low of 23.3% on Jun 1, 2024 and a high of 43.5% on Aug 30, 2025.
