Campbell Soup Co
F:CSC

Decide at what price you'd be comfortable buying and we'll help you stay ready.

|
Johnson & Johnson
NYSE:JNJ
|
US |

|
Berkshire Hathaway Inc
NYSE:BRK.A
|
US |

|
Bank of America Corp
NYSE:BAC
|
US |

|
Mastercard Inc
NYSE:MA
|
US |

|
UnitedHealth Group Inc
NYSE:UNH
|
US |

|
Exxon Mobil Corp
NYSE:XOM
|
US |

|
Pfizer Inc
NYSE:PFE
|
US |

|
Nike Inc
NYSE:NKE
|
US |

|
Visa Inc
NYSE:V
|
US |

|
Alibaba Group Holding Ltd
NYSE:BABA
|
CN |

|
JPMorgan Chase & Co
NYSE:JPM
|
US |

|
Coca-Cola Co
NYSE:KO
|
US |

|
Verizon Communications Inc
NYSE:VZ
|
US |

|
Chevron Corp
NYSE:CVX
|
US |

|
Walt Disney Co
NYSE:DIS
|
US |

|
PayPal Holdings Inc
NASDAQ:PYPL
|
US |
EV/GP
Enterprise Value to Gross Profit (EV/GP) ratio compares a company`s total enterprise value to its gross profit. It shows how much investors are paying for each dollar of the company`s gross profit, including both equity and debt.
Enterprise Value to Gross Profit (EV/GP) ratio compares a company`s total enterprise value to its gross profit. It shows how much investors are paying for each dollar of the company`s gross profit, including both equity and debt.
Valuation Scenarios
If EV/GP returns to its 3-Year Average (5.9), the stock would be worth €25.15 (40% upside from current price).
| Scenario | EV/GP Value | Implied Price | Upside/Downside |
|---|---|---|---|
| Current Multiple | 4.2 | €17.93 |
0%
|
| 3-Year Average | 5.9 | €25.15 |
+40%
|
| 5-Year Average | 6 | €25.39 |
+42%
|
| Industry Average | 6 | €25.59 |
+43%
|
| Country Average | 6.5 | €27.59 |
+54%
|
Forward EV/GP
Today’s price vs future gross profit
Peer Comparison
| Market Cap | EV/GP | P/E | ||||
|---|---|---|---|---|---|---|
| US |

|
Campbell Soup Co
F:CSC
|
6.1B EUR | 4.2 | 11.1 | |
| JP |
G
|
Goyo Foods Industry Co Ltd
TSE:2230
|
53.2T JPY | 70 536.4 | 540 752.8 | |
| CH |

|
Nestle SA
SIX:NESN
|
206.9B CHF | 6 | 22.5 | |
| US |

|
Mondelez International Inc
NASDAQ:MDLZ
|
78.2B USD | 8.8 | 31.9 | |
| FR |

|
Danone SA
PAR:BN
|
42.4B EUR | 3.5 | 23.3 | |
| ZA |
T
|
Tiger Brands Ltd
JSE:TBS
|
48.7B ZAR | 4.1 | 12.8 | |
| US |

|
Hershey Co
NYSE:HSY
|
38.4B USD | 10.8 | 43.4 | |
| CN |

|
Muyuan Foods Co Ltd
SZSE:002714
|
236.5B CNY | 14.6 | 25.2 | |
| CN |

|
Foshan Haitian Flavouring and Food Co Ltd
SSE:603288
|
229.3B CNY | 16.8 | 32.6 | |
| ZA |
A
|
Avi Ltd
JSE:AVI
|
33B ZAR | 4.7 | 12.8 | |
| IN |

|
Nestle India Ltd
NSE:NESTLEIND
|
2.8T INR | 21.9 | 80.5 |
Market Distribution
| Min | 0 |
| 30th Percentile | 4.2 |
| Median | 6.5 |
| 70th Percentile | 10.6 |
| Max | 1 764 211.7 |
Other Multiples
Campbell Soup Co
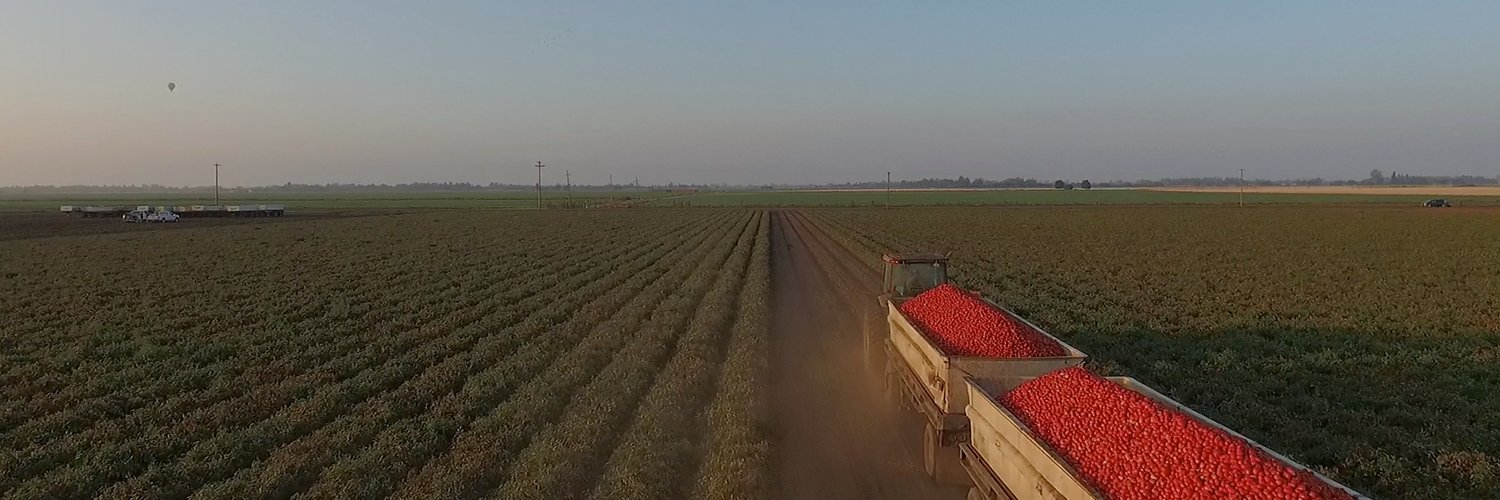
Glance View
Campbell Soup Co. has long been a staple in the global food industry, captivating generations with its iconic red-and-white cans. The company’s journey began in 1869 and has since evolved into a diverse portfolio that extends beyond its classic soups. Today, Campbell's business is a tapestry of brands and products that cater to a wide array of consumer tastes and preferences. From Pepperidge Farm’s baked goods to V8 beverages, Campbell incorporates a strategy of building strong brands and focusing on product innovation. This holistic approach has enabled it to capture the shifting dining habits of consumers who are increasingly seeking convenience, flavor diversity, and nutritional balance in their meals. Core to Campbell's operations is its robust supply chain, which is bolstered by strategic acquisitions and partnerships that ensure it remains both competitive and resilient. The company primarily generates revenue through the sale of its consumer packaged foods across the retail grocery, food service, and e-commerce sectors. With a commitment to maintaining affordability while delivering quality, Campbell navigates challenges such as fluctuating agricultural prices and changing consumer demands by continuously optimizing its production processes and distribution networks. By leveraging its rich history and brand trust, Campbell continues to adapt in a market that values both classic favorites and modern culinary innovations.
