Gujarat Industries Power Company Ltd
BSE:517300

Decide at what price you'd be comfortable buying and we'll help you stay ready.

|
Johnson & Johnson
NYSE:JNJ
|
US |

|
Berkshire Hathaway Inc
NYSE:BRK.A
|
US |

|
Bank of America Corp
NYSE:BAC
|
US |

|
Mastercard Inc
NYSE:MA
|
US |

|
UnitedHealth Group Inc
NYSE:UNH
|
US |

|
Exxon Mobil Corp
NYSE:XOM
|
US |

|
Pfizer Inc
NYSE:PFE
|
US |

|
Nike Inc
NYSE:NKE
|
US |

|
Visa Inc
NYSE:V
|
US |

|
Alibaba Group Holding Ltd
NYSE:BABA
|
CN |

|
JPMorgan Chase & Co
NYSE:JPM
|
US |

|
Coca-Cola Co
NYSE:KO
|
US |

|
Verizon Communications Inc
NYSE:VZ
|
US |

|
Chevron Corp
NYSE:CVX
|
US |

|
Walt Disney Co
NYSE:DIS
|
US |

|
PayPal Holdings Inc
NASDAQ:PYPL
|
US |
EV/EBIT
Enterprise Value to EBIT (EV/EBIT) ratio compares a company`s total enterprise value to its earnings before interest and taxes. It shows how much investors are paying for each dollar of the company`s earnings, including both equity and debt.
Enterprise Value to EBIT (EV/EBIT) ratio compares a company`s total enterprise value to its earnings before interest and taxes. It shows how much investors are paying for each dollar of the company`s earnings, including both equity and debt.
Valuation Scenarios
If EV/EBIT returns to its 3-Year Average (13.3), the stock would be worth ₹98.74 (37% downside from current price).
| Scenario | EV/EBIT Value | Implied Price | Upside/Downside |
|---|---|---|---|
| Current Multiple | 21 | ₹156.15 |
0%
|
| 3-Year Average | 13.3 | ₹98.74 |
-37%
|
| 5-Year Average | 11.3 | ₹84.15 |
-46%
|
| Industry Average | 16.7 | ₹123.96 |
-21%
|
| Country Average | 23.3 | ₹172.93 |
+11%
|
Forward EV/EBIT
Today’s price vs future ebit
| Today's Enterprise Value | EBIT | Forward EV/EBIT | ||
|---|---|---|---|---|
|
₹46.9B
|
/ |
Jan 2026
₹2.3B
|
= |
|
|
₹46.9B
|
/ |
Mar 2026
₹3.5B
|
= |
|
|
₹46.9B
|
/ |
Mar 2027
₹5.3B
|
= |
|
Forward EV/EBIT shows whether today’s EV/EBIT still looks high or low once future ebit are taken into account.
Peer Comparison
| Market Cap | EV/EBIT | P/E | ||||
|---|---|---|---|---|---|---|
| IN |

|
Gujarat Industries Power Company Ltd
BSE:517300
|
24.2B INR | 21 | 16.7 | |
| US |

|
Vistra Corp
NYSE:VST
|
53B USD | 34.7 | 73.8 | |
| SA |

|
ACWA Power Co
SAU:2082
|
184.5B SAR | 80.2 | 99.6 | |
| IN |

|
Adani Power Ltd
NSE:ADANIPOWER
|
4.1T INR | 28.2 | 35.7 | |
| IN |

|
NTPC Ltd
NSE:NTPC
|
3.9T INR | 15.8 | 16.2 | |
| CN |

|
CGN Power Co Ltd
SZSE:003816
|
235.3B CNY | 22.3 | 24.1 | |
| CN |

|
China National Nuclear Power Co Ltd
SSE:601985
|
187B CNY | 20.2 | 21.7 | |
| TH |
G
|
Gulf Energy Development PCL
SET:GULF
|
836.6B THB | 53.3 | 39.1 | |
| DE |

|
Uniper SE
XETRA:UN0
|
17.4B EUR | 15.7 | 12.2 | |
| CN |

|
SDIC Power Holdings Co Ltd
SSE:600886
|
108.1B CNY | 12.9 | 16.5 | |
| US |

|
Talen Energy Corp
NASDAQ:TLN
|
15.8B USD | -776.7 | -75.5 |
Market Distribution
| Min | 0.4 |
| 30th Percentile | 15.7 |
| Median | 23.3 |
| 70th Percentile | 34.7 |
| Max | 48 145.1 |
Other Multiples
Gujarat Industries Power Company Ltd
Glance View
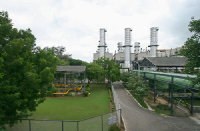
Gujarat Industries Power Co. Ltd. engages in the business of electrical power generation. The company is headquartered in Vadodara, Gujarat. The firm has a diversified portfolio of thermal (gas and lignite), wind and solar power plant assets in the state of Gujarat. Its operational projects include 310 megawatts (MW) gas-based combined cycle power plant at Baroda, 500 MW lignite-based power plant with captive mines, Nani Naroli, at Taluka in Mangrol, Surat district and 374.4 MW renewable energy, which consists of utility scale wind and solar projects. Its gas-based power plants include Vadodara Station-I and Vadodara Station-II. Its lignite power plant includes Surat Lignite Power Plant. The company also has various solar as well as wind farms. The company has projects in Vastan Lignite Mine and Mangrol-Valia Lignite Mine.
