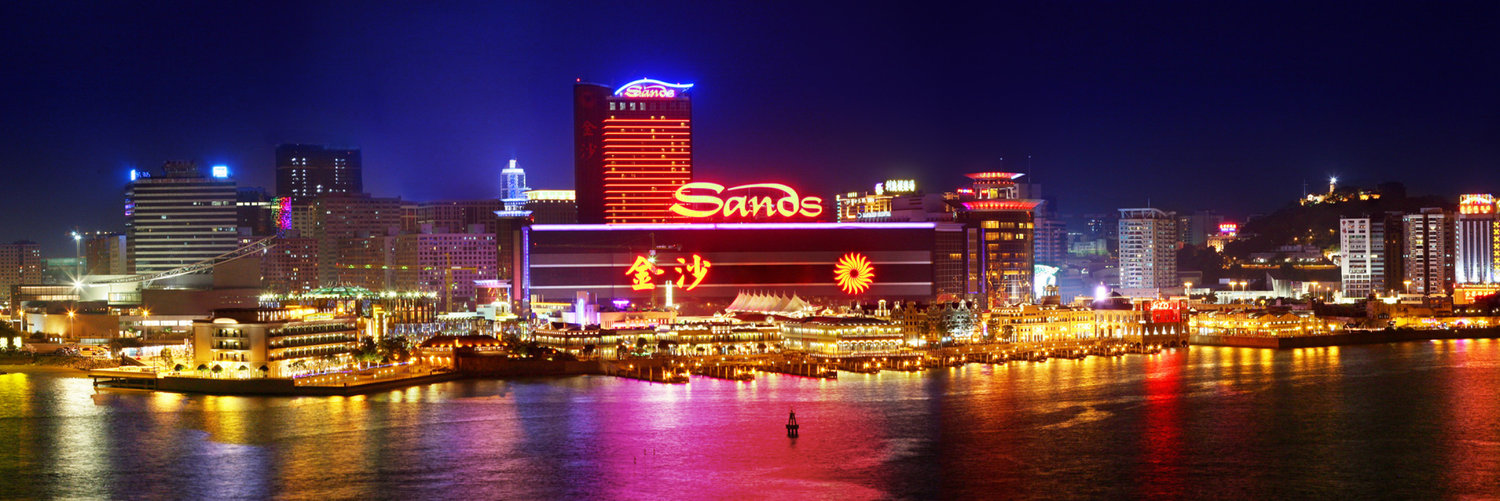

Sands China Ltd
HKEX:1928

Decide at what price you'd be comfortable buying and we'll help you stay ready.

|
Sands China Ltd
HKEX:1928
|
MO |
|
C
|
C banner International Holdings Ltd
HKEX:1028
|
CN |
|
L
|
Lianhe Sowell International Group Ltd
NASDAQ:LHSW
|
CN |
|
E
|
EuBiologics Co Ltd
KOSDAQ:206650
|
KR |
|
M
|
Major Development PCL
SET:MJD
|
TH |

|
Tianjin Printronics Circuit Corp
SZSE:002134
|
CN |
|
E
|
Eluon Corp
KOSDAQ:065440
|
KR |
|
J
|
JG Summit Holdings Inc
XPHS:JGS
|
PH |
|
P
|
Psyence Group Inc
CNSX:PSYG
|
CA |
|
A
|
Acrysil Ltd
NSE:ACRYSIL
|
IN |
|
A
|
APAC Resources Ltd
HKEX:1104
|
HK |
|
Daifuku Co Ltd
TSE:6383
|
JP |

|
Mutoh Holdings Co Ltd
TSE:7999
|
JP |
Profitability Summary
Sands China Ltd's profitability score is hidden . We take all the information about a company's profitability (such as its margins, capital efficiency, free cash flow generating ability, and more) and consolidate it into one single number - the profitability score. The higher the profitability score, the more profitable the company is.
Profitability Score
We take all the information about a company's profitability (such as its margins, capital efficiency, free cash flow generating ability, and more) and consolidate it into one single number - the profitability score. The higher the profitability score, the more profitable the company is.
We take all the information about a company's profitability (such as its margins, capital efficiency, free cash flow generating ability, and more) and consolidate it into one single number - the profitability score. The higher the profitability score, the more profitable the company is.
Profitability Score
Margins
Earnings Waterfall
Sands China Ltd
Margins Comparison
Sands China Ltd Competitors
| Country | Company | Market Cap |
Gross Margin |
Operating Margin |
Net Margin |
||
|---|---|---|---|---|---|---|---|
| MO |
|
Sands China Ltd
HKEX:1928
|
131.8B HKD |
Loading...
|
Loading...
|
Loading...
|
|
| US |

|
Las Vegas Sands Corp
NYSE:LVS
|
35.7B USD |
Loading...
|
Loading...
|
Loading...
|
|
| HK |

|
Galaxy Entertainment Group Ltd
HKEX:27
|
156.2B HKD |
Loading...
|
Loading...
|
Loading...
|
|
| AU |

|
Aristocrat Leisure Ltd
ASX:ALL
|
27.9B AUD |
Loading...
|
Loading...
|
Loading...
|
|
| IE |

|
Flutter Entertainment PLC
LSE:FLTR
|
14B GBP |
Loading...
|
Loading...
|
Loading...
|
|
| SE |

|
Evolution AB (publ)
STO:EVO
|
115.2B SEK |
Loading...
|
Loading...
|
Loading...
|
|
| US |

|
DraftKings Inc
NASDAQ:DKNG
|
11.7B USD |
Loading...
|
Loading...
|
Loading...
|
|
| US |

|
Wynn Resorts Ltd
NASDAQ:WYNN
|
10.4B USD |
Loading...
|
Loading...
|
Loading...
|
|
| ZA |
S
|
Sun International Ltd
JSE:SUI
|
9.8B ZAR |
Loading...
|
Loading...
|
Loading...
|
|
| US |

|
MGM Resorts International
NYSE:MGM
|
9.1B USD |
Loading...
|
Loading...
|
Loading...
|
|
| US |

|
Light & Wonder Inc
NASDAQ:LNW
|
8.6B USD |
Loading...
|
Loading...
|
Loading...
|
Return on Capital
Return on Capital Comparison
Sands China Ltd Competitors
| Country | Company | Market Cap | ROE | ROA | ROCE | ROIC | ||
|---|---|---|---|---|---|---|---|---|
| MO |
|
Sands China Ltd
HKEX:1928
|
131.8B HKD |
Loading...
|
Loading...
|
Loading...
|
Loading...
|
|
| US |
|
Las Vegas Sands Corp
NYSE:LVS
|
35.7B USD |
Loading...
|
Loading...
|
Loading...
|
Loading...
|
|
| HK |
|
Galaxy Entertainment Group Ltd
HKEX:27
|
156.2B HKD |
Loading...
|
Loading...
|
Loading...
|
Loading...
|
|
| AU |
|
Aristocrat Leisure Ltd
ASX:ALL
|
27.9B AUD |
Loading...
|
Loading...
|
Loading...
|
Loading...
|
|
| IE |
|
Flutter Entertainment PLC
LSE:FLTR
|
14B GBP |
Loading...
|
Loading...
|
Loading...
|
Loading...
|
|
| SE |
|
Evolution AB (publ)
STO:EVO
|
115.2B SEK |
Loading...
|
Loading...
|
Loading...
|
Loading...
|
|
| US |
|
DraftKings Inc
NASDAQ:DKNG
|
11.7B USD |
Loading...
|
Loading...
|
Loading...
|
Loading...
|
|
| US |
|
Wynn Resorts Ltd
NASDAQ:WYNN
|
10.4B USD |
Loading...
|
Loading...
|
Loading...
|
Loading...
|
|
| ZA |
S
|
Sun International Ltd
JSE:SUI
|
9.8B ZAR |
Loading...
|
Loading...
|
Loading...
|
Loading...
|
|
| US |
|
MGM Resorts International
NYSE:MGM
|
9.1B USD |
Loading...
|
Loading...
|
Loading...
|
Loading...
|
|
| US |
|
Light & Wonder Inc
NASDAQ:LNW
|
8.6B USD |
Loading...
|
Loading...
|
Loading...
|
Loading...
|
