
Glanbia PLC
ISEQ:GL9

Decide at what price you'd be comfortable buying and we'll help you stay ready.

|
Johnson & Johnson
NYSE:JNJ
|
US |

|
Berkshire Hathaway Inc
NYSE:BRK.A
|
US |

|
Bank of America Corp
NYSE:BAC
|
US |

|
Mastercard Inc
NYSE:MA
|
US |

|
UnitedHealth Group Inc
NYSE:UNH
|
US |

|
Exxon Mobil Corp
NYSE:XOM
|
US |

|
Pfizer Inc
NYSE:PFE
|
US |

|
Nike Inc
NYSE:NKE
|
US |

|
Visa Inc
NYSE:V
|
US |

|
Alibaba Group Holding Ltd
NYSE:BABA
|
CN |

|
JPMorgan Chase & Co
NYSE:JPM
|
US |

|
Coca-Cola Co
NYSE:KO
|
US |

|
Verizon Communications Inc
NYSE:VZ
|
US |

|
Chevron Corp
NYSE:CVX
|
US |

|
Walt Disney Co
NYSE:DIS
|
US |

|
PayPal Holdings Inc
NASDAQ:PYPL
|
US |
EV/FCFF
Enterprise Value to Free Cash Flow to Firm (EV/FCFF) ratio compares a company`s total enterprise value to the free cash flow available to all investors, both debt and equity holders. It shows how much investors are paying for each dollar of cash flow the business generates before interest payments.
Enterprise Value to Free Cash Flow to Firm (EV/FCFF) ratio compares a company`s total enterprise value to the free cash flow available to all investors, both debt and equity holders. It shows how much investors are paying for each dollar of cash flow the business generates before interest payments.
Valuation Scenarios
If EV/FCFF returns to its 3-Year Average (15.7), the stock would be worth €14.37 (27% downside from current price).
| Scenario | EV/FCFF Value | Implied Price | Upside/Downside |
|---|---|---|---|
| Current Multiple | 21.6 | €19.78 |
0%
|
| 3-Year Average | 15.7 | €14.37 |
-27%
|
| 5-Year Average | 17.8 | €16.29 |
-18%
|
| Industry Average | 18.7 | €17.1 |
-14%
|
| Country Average | 18.7 | €17.1 |
-14%
|
Forward EV/FCFF
Today’s price vs future free cash flow to firm
Peer Comparison
| Market Cap | EV/FCFF | P/E | ||||
|---|---|---|---|---|---|---|
| IE |

|
Glanbia PLC
ISEQ:GL9
|
4.8B EUR | 21.6 | 30.3 | |
| JP |
G
|
Goyo Foods Industry Co Ltd
TSE:2230
|
53.2T JPY | 468 975.5 | 540 752.8 | |
| CH |

|
Nestle SA
SIX:NESN
|
203.3B CHF | 22.1 | 22.5 | |
| US |

|
Mondelez International Inc
NASDAQ:MDLZ
|
78.7B USD | 29.8 | 32.1 | |
| FR |

|
Danone SA
PAR:BN
|
42.7B EUR | 17.8 | 23.5 | |
| ZA |
T
|
Tiger Brands Ltd
JSE:TBS
|
47.6B ZAR | 39.4 | 12.5 | |
| US |

|
Hershey Co
NYSE:HSY
|
37.7B USD | 23.8 | 42.7 | |
| CN |

|
Muyuan Foods Co Ltd
SZSE:002714
|
244.2B CNY | 28.2 | 25 | |
| CN |

|
Foshan Haitian Flavouring and Food Co Ltd
SSE:603288
|
225.7B CNY | 29.6 | 32.1 | |
| ZA |
A
|
Avi Ltd
JSE:AVI
|
33.1B ZAR | 12.4 | 12.8 | |
| JP |

|
Ajinomoto Co Inc
TSE:2802
|
4.7T JPY | 42 | 60.6 |
Market Distribution
| Min | 0 |
| 30th Percentile | 13 |
| Median | 18.7 |
| 70th Percentile | 27.5 |
| Max | 2 454.8 |
Other Multiples
Glanbia PLC
Glance View
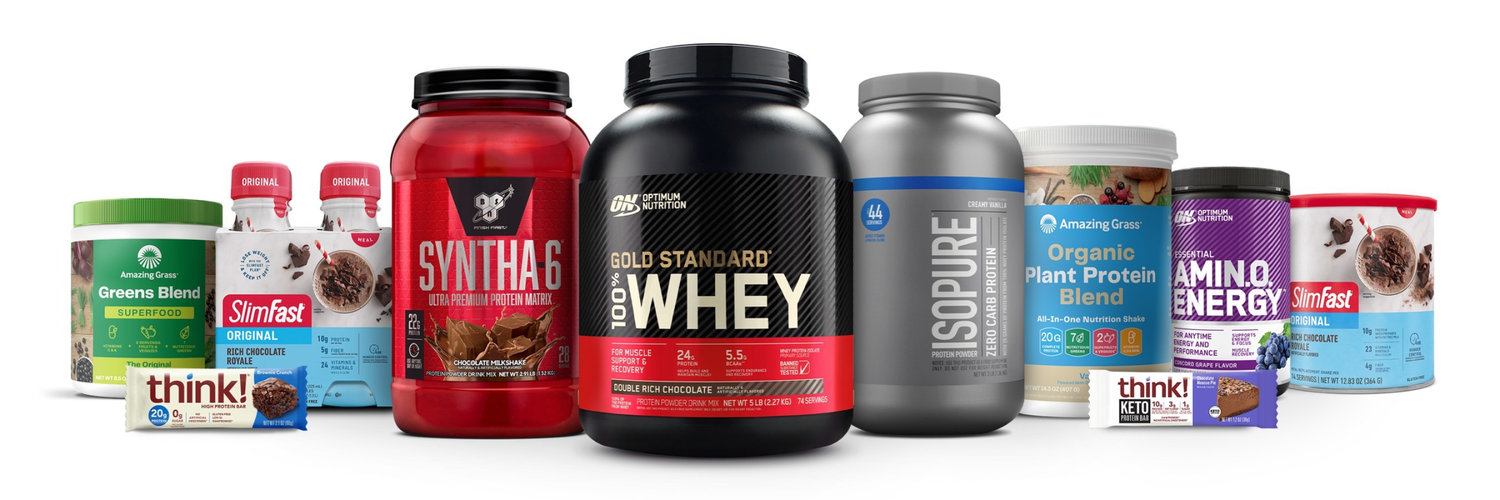
Glanbia PLC, with roots firmly embedded in the Emerald Isle, is a testament to the evolution and innovation in the global food industry. Originally emerging from the dairy cooperatives of Ireland, Glanbia has masterfully transformed itself from a local dairy operation into a global nutritional powerhouse. At the heart of its operations is a deep-seated commitment to nutrition – crafting products that cater to the growing global demand for healthier, functional foods. The company's business model is intricately woven around two core divisions: Glanbia Performance Nutrition, which crafts and supplies a diverse portfolio of performance nutrition products, and Glanbia Nutritionals, which delivers bespoke nutritional solutions through its comprehensive dairy and non-dairy ingredients. These synergistic divisions allow Glanbia to tap into and steer multiple nodes of the health and wellness megatrend. The financial heartbeat of Glanbia comes from its ability to marry science with nutritional innovation. By leveraging advanced research and development capabilities, the company consistently innovates, ensuring its offerings remain at the cutting edge of consumer trends. Glanbia Performance Nutrition's leading brands like Optimum Nutrition and SlimFast cater to fitness enthusiasts and health-conscious consumers, translating into robust sales globally. Meanwhile, Glanbia Nutritionals' sophisticated ingredients and solutions, utilized by leading brands in the food and beverage industry, underpin a reliable revenue stream. This dual-engine strategy ensures Glanbia not only meets current market demands but is also strategically positioned to adapt to the fluid dynamics of the health-focused consumer marketplace. Through this, Glanbia PLC fortifies its standing as not just a company, but a vital participant in the global narrative of nutritional well-being.
