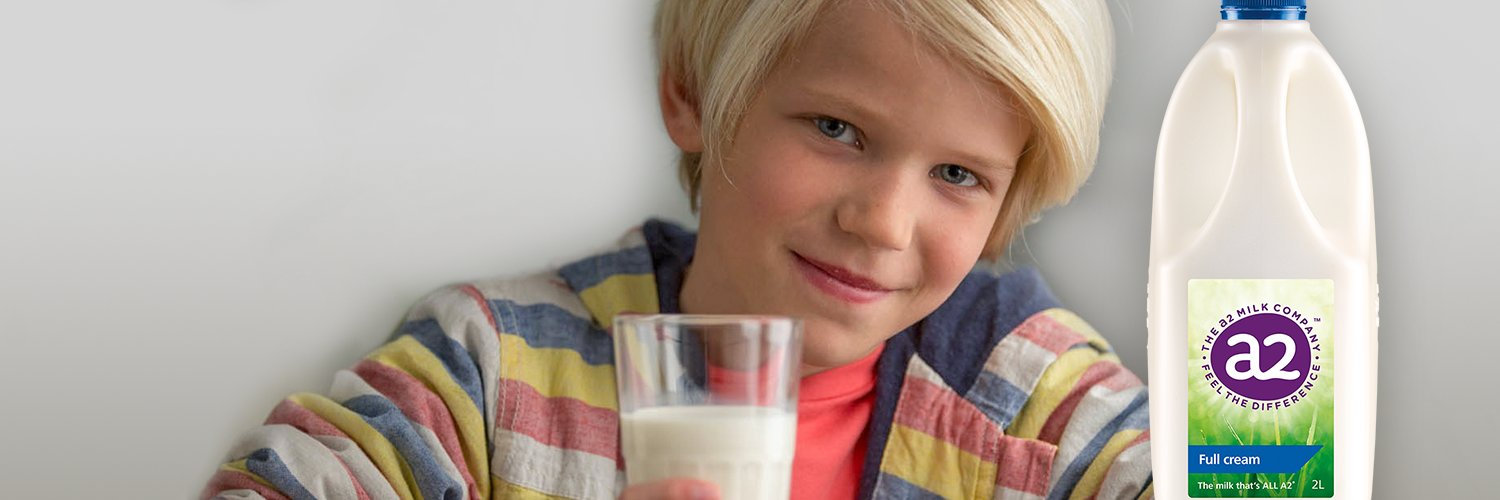
A2 Milk Company Ltd
NZX:ATM

Decide at what price you'd be comfortable buying and we'll help you stay ready.

|
Johnson & Johnson
NYSE:JNJ
|
US |

|
Berkshire Hathaway Inc
NYSE:BRK.A
|
US |

|
Bank of America Corp
NYSE:BAC
|
US |

|
Mastercard Inc
NYSE:MA
|
US |

|
UnitedHealth Group Inc
NYSE:UNH
|
US |

|
Exxon Mobil Corp
NYSE:XOM
|
US |

|
Pfizer Inc
NYSE:PFE
|
US |

|
Nike Inc
NYSE:NKE
|
US |

|
Visa Inc
NYSE:V
|
US |

|
Alibaba Group Holding Ltd
NYSE:BABA
|
CN |

|
JPMorgan Chase & Co
NYSE:JPM
|
US |

|
Coca-Cola Co
NYSE:KO
|
US |

|
Verizon Communications Inc
NYSE:VZ
|
US |

|
Chevron Corp
NYSE:CVX
|
US |

|
Walt Disney Co
NYSE:DIS
|
US |

|
PayPal Holdings Inc
NASDAQ:PYPL
|
US |
EV/EBITDA
Enterprise Value to EBITDA (EV/EBITDA) ratio compares a company`s total enterprise value to its earnings before interest, taxes, depreciation, and amortization. It shows how much investors are paying for each dollar of the company`s earnings, including both equity and debt.
Enterprise Value to EBITDA (EV/EBITDA) ratio compares a company`s total enterprise value to its earnings before interest, taxes, depreciation, and amortization. It shows how much investors are paying for each dollar of the company`s earnings, including both equity and debt.
Valuation Scenarios
If EV/EBITDA returns to its 3-Year Average (20.6), the stock would be worth NZ$9.52 (4% upside from current price).
| Scenario | EV/EBITDA Value | Implied Price | Upside/Downside |
|---|---|---|---|
| Current Multiple | 19.8 | NZ$9.13 |
0%
|
| 3-Year Average | 20.6 | NZ$9.52 |
+4%
|
| 5-Year Average | 21.4 | NZ$9.87 |
+8%
|
| Industry Average | 11.7 | NZ$5.4 |
-41%
|
| Country Average | 18.3 | NZ$8.45 |
-7%
|
Forward EV/EBITDA
Today’s price vs future ebitda
| Today's Enterprise Value | EBITDA | Forward EV/EBITDA | ||
|---|---|---|---|---|
|
NZ$7.3B
|
/ |
Jan 2026
NZ$290.5m
|
= |
|
|
NZ$7.3B
|
/ |
Jun 2026
NZ$327.9m
|
= |
|
|
NZ$7.3B
|
/ |
Jun 2027
NZ$392.3m
|
= |
|
|
NZ$7.3B
|
/ |
Jun 2028
NZ$464.8m
|
= |
|
Forward EV/EBITDA shows whether today’s EV/EBITDA still looks high or low once future ebitda are taken into account.
Peer Comparison
| Market Cap | EV/EBITDA | P/E | ||||
|---|---|---|---|---|---|---|
| NZ |
|
A2 Milk Company Ltd
NZX:ATM
|
6.6B NZD | 19.8 | 54.6 | |
| JP |
G
|
Goyo Foods Industry Co Ltd
TSE:2230
|
53.2T JPY | 186 542.5 | 540 752.8 | |
| CH |

|
Nestle SA
SIX:NESN
|
205.8B CHF | 14.1 | 23.2 | |
| US |

|
Mondelez International Inc
NASDAQ:MDLZ
|
73.8B USD | 18.3 | 30.1 | |
| FR |

|
Danone SA
PAR:BN
|
43.3B EUR | 9.8 | 23.8 | |
| ZA |
T
|
Tiger Brands Ltd
JSE:TBS
|
48.7B ZAR | 9.4 | 12.8 | |
| US |

|
Hershey Co
NYSE:HSY
|
38.8B USD | 21.3 | 44 | |
| CN |

|
Muyuan Foods Co Ltd
SZSE:002714
|
237.6B CNY | 22 | 24.3 | |
| CN |

|
Foshan Haitian Flavouring and Food Co Ltd
SSE:603288
|
231.2B CNY | 24.7 | 32.8 | |
| ZA |
A
|
Avi Ltd
JSE:AVI
|
32.7B ZAR | 8.6 | 12.7 | |
| CH |

|
Chocoladefabriken Lindt & Spruengli AG
SIX:LISN
|
23.8B CHF | 19.2 | 32.4 |
Market Distribution
| Min | 4.2 |
| 30th Percentile | 14.7 |
| Median | 18.3 |
| 70th Percentile | 28.5 |
| Max | 518.2 |
Other Multiples
A2 Milk Company Ltd
Glance View
A2 Milk Company Ltd, hailing from New Zealand, has carved out a unique niche within the global dairy industry by revolutionizing the way people perceive and consume milk. Founded in 2000 by Dr. Corran McLachlan and Howard Paterson, the company diverged from traditional dairy producers by focusing exclusively on milk that contains only the A2 beta-casein protein. The science behind this innovation is grounded in research suggesting that A2 milk could offer digestive benefits for those sensitive to the more common A1 protein found in most cow's milk. This unique selling proposition allowed A2 Milk to position itself as a premium product, catering to health-conscious consumers and those seeking alternatives to regular dairy products. Through rigorous marketing and strategic product differentiation, A2 Milk expanded its footprint into major markets such as Australia, China, and the United States, establishing itself as a global player. The company's business model is strategically designed around branding and supply chain efficiency. A2 Milk operates by partnering with dairy farmers who specifically breed cows that produce only the A2 protein, ensuring authenticity and consistency in their product offerings. This approach not only supports a robust supply chain but also fosters strong relationships with suppliers and enhances quality control. A2 Milk generates revenue primarily through the sale of fresh milk, infant formula, milk powder, and other related dairy products. This portfolio diversification helps mitigate risks and tap into various customer segments. Moreover, A2 Milk's success lies in its ability to leverage strategic partnerships, innovative marketing, and consumer trust to maintain its competitive edge in the niche market, attracting both loyal customers and investors alike.
