Wesfarmers Ltd
SWB:WF3

Decide at what price you'd be comfortable buying and we'll help you stay ready.

|
Johnson & Johnson
NYSE:JNJ
|
US |

|
Berkshire Hathaway Inc
NYSE:BRK.A
|
US |

|
Bank of America Corp
NYSE:BAC
|
US |

|
Mastercard Inc
NYSE:MA
|
US |

|
UnitedHealth Group Inc
NYSE:UNH
|
US |

|
Exxon Mobil Corp
NYSE:XOM
|
US |

|
Pfizer Inc
NYSE:PFE
|
US |

|
Nike Inc
NYSE:NKE
|
US |

|
Visa Inc
NYSE:V
|
US |

|
Alibaba Group Holding Ltd
NYSE:BABA
|
CN |

|
JPMorgan Chase & Co
NYSE:JPM
|
US |

|
Coca-Cola Co
NYSE:KO
|
US |

|
Verizon Communications Inc
NYSE:VZ
|
US |

|
Chevron Corp
NYSE:CVX
|
US |

|
Walt Disney Co
NYSE:DIS
|
US |

|
PayPal Holdings Inc
NASDAQ:PYPL
|
US |
P/FCFE
Price to Free Cash Flow to Equity (P/FCFE) ratio compares a company`s market value to the free cash flow available to its shareholders. It`s similar to the P/OCF ratio but more precise, since it accounts for capital expenditures deducted from operating cash flow.
Price to Free Cash Flow to Equity (P/FCFE) ratio compares a company`s market value to the free cash flow available to its shareholders. It`s similar to the P/OCF ratio but more precise, since it accounts for capital expenditures deducted from operating cash flow.
Valuation Scenarios
If P/FCFE returns to its 3-Year Average (33.6), the stock would be worth €66.75 (51% upside from current price).
| Scenario | P/FCFE Value | Implied Price | Upside/Downside |
|---|---|---|---|
| Current Multiple | 22.2 | €44.17 |
0%
|
| 3-Year Average | 33.6 | €66.75 |
+51%
|
| 5-Year Average | 27.7 | €55 |
+25%
|
| Industry Average | 18.9 | €37.66 |
-15%
|
| Country Average | 18.1 | €35.93 |
-19%
|
Forward P/FCFE
Today’s price vs future free cash flow to equity
Peer Comparison
| Market Cap | P/FCFE | P/E | ||||
|---|---|---|---|---|---|---|
| AU |

|
Wesfarmers Ltd
SWB:WF3
|
83.4B EUR | 22.2 | 27 | |
| US |

|
Target Corp
NYSE:TGT
|
58.4B USD | 21.7 | 15.8 | |
| CA |

|
Dollarama Inc
TSX:DOL
|
47.3B CAD | 36.2 | 35.6 | |
| US |

|
Dollar General Corp
NYSE:DG
|
25.2B USD | 51.1 | 16.7 | |
| US |

|
Dollar Tree Inc
NASDAQ:DLTR
|
18.8B USD | 61.5 | 14.7 | |
| JP |

|
Pan Pacific International Holdings Corp
TSE:7532
|
2.7T JPY | 71.7 | 26.5 | |
| JP |

|
Ryohin Keikaku Co Ltd
TSE:7453
|
1.9T JPY | 55.9 | 23.6 | |
| CA |

|
Canadian Tire Corporation Ltd
TSX:CTC.A
|
10B CAD | -17.9 | 19 | |
| US |

|
Ollie's Bargain Outlet Holdings Inc
NASDAQ:OLLI
|
5.2B USD | 27.1 | 21.7 | |
| CN |
M
|
MINISO Group Holding Ltd
HKEX:9896
|
35B HKD | 6.5 | 25.5 | |
| AU |

|
Harvey Norman Holdings Ltd
ASX:HVN
|
5.6B AUD | 9.6 | 9.9 |
Market Distribution
| Min | 0.2 |
| 30th Percentile | 12.5 |
| Median | 18.1 |
| 70th Percentile | 35.6 |
| Max | 5 049.1 |
Other Multiples
Wesfarmers Ltd
Glance View
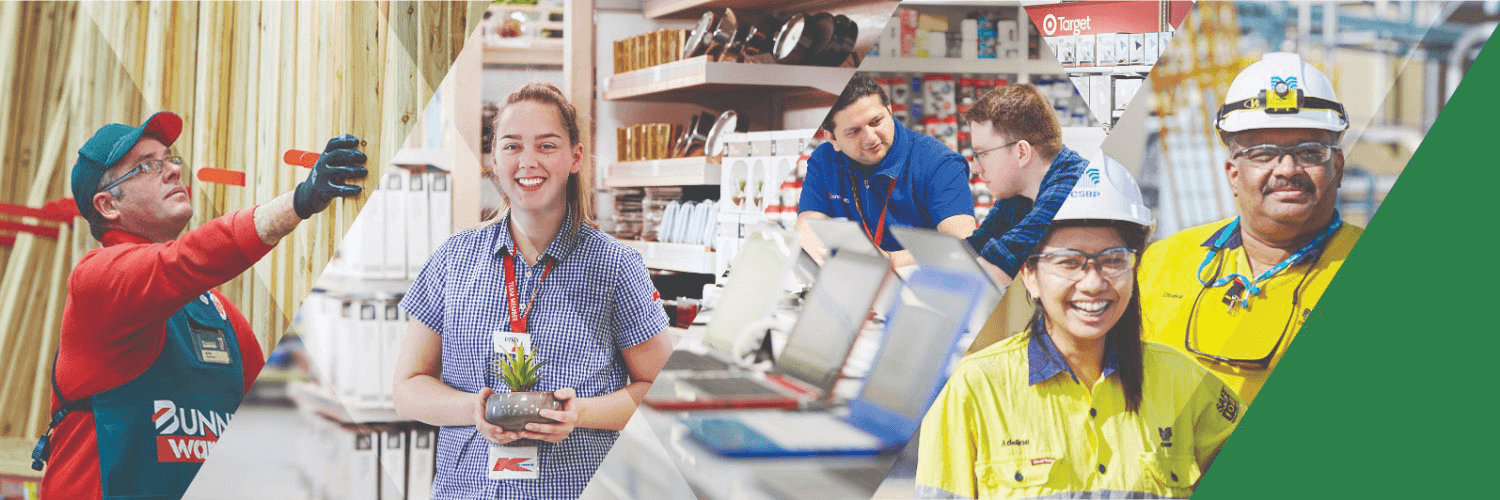
In the vast, sunburned expanse of Australia, where the economy hums more like a well-tuned machine than a casual outback song, Wesfarmers Ltd. stands as a towering figure. Emerging from its humble beginnings in 1914 as a co-operative for Western Australian farmers, it has evolved into one of the country's largest and most diversified public companies. Wesfarmers' journey resembles a meticulously well-crafted novel, with each chapter capturing its ventures across industries and sectors. Today, Wesfarmers operates primarily in retail, with its flagship brands like Bunnings Warehouse, Kmart, and Target touching nearly every aspect of Australian daily life, offering everything from home improvement products to affordable household items. Its retail operations thrive on a model of meeting consumer demand through an extensive network of stores supported by highly efficient supply chains. But the story of Wesfarmers extends beyond retail aisles and shopping carts. The company skillfully diversified its portfolio, weaving in operations in chemicals, fertilizers, and industrial safety products, thereby ensuring its financial resilience. It manages a balanced ecosystem where each business unit contributes strategically to the bottom line. This approach allows Wesfarmers to generate revenue not merely through direct sales but also through an interplay of industrial and commercial synergies. While retail remains the lion’s share of its income, Wesfarmers' strategic investments in technology and innovation in both its traditional and non-traditional sectors highlight an underlying mantra of sustainable growth and careful market adaptation, firmly anchoring it as a pivotal player not only in Australia but also in the broader economic landscapes it navigates.
