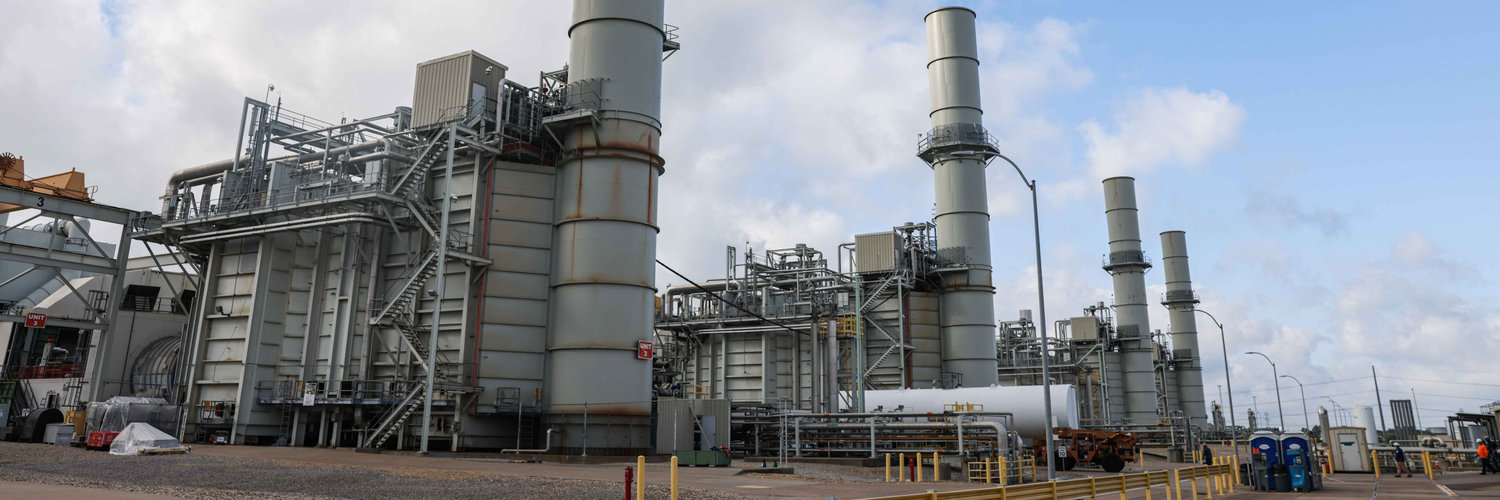
Vistra Corp
NYSE:VST

Watchlist Manager
Vistra Corp Logo
Vistra Corp
NYSE:VST
Watchlist
Price: 160.57 USD 0.53% Market Closed
Market Cap: 54.6B USD

Profitability Summary

We take all the information about a company's profitability (such as its margins, capital efficiency, free cash flow generating ability, and more) and consolidate it into one single number - the profitability score. The higher the profitability score, the more profitable the company is.

Past Growth

Analyzing past growth in Revenue, Operating Income, and Net Income allows investors to assess the company's profitability and operational efficiency. Consistent improvement in these metrics typically signals long-term strength and stability.

Show More Less

Margins

Profit margins represent what percentage of sales has turned into profits. Simply put, the percentage figure indicates how many cents of profit the company has generated for each dollar of sale.

Profit margins help investors assess if a company's management is generating enough profit from its sales and whether operating costs and overhead costs are being contained.

Show More Less

Earnings Waterfall
Vistra Corp

Revenue
18.1B USD
Cost of Revenue
-111m USD
Gross Profit
18B USD
Operating Expenses
-14.1B USD
Operating Income
3.9B USD
Other Expenses
-1.6B USD
Net Income
2.2B USD

Margins Comparison
Vistra Corp Competitors

Country Company Market Cap Gross
Margin
Operating
Margin
Net
Margin
US
Vistra Corp
NYSE:VST
54.6B USD
99%
21%
12%
DE
Uniper SE
XETRA:UN01
562.9B EUR
-1%
-2%
-7%
SA
ACWA Power Co
SAU:2082
284.4B SAR
54%
31%
27%
IN
NTPC Ltd
NSE:NTPC
3.2T INR
42%
20%
12%
CN
China National Nuclear Power Co Ltd
SSE:601985
197B CNY
41%
37%
12%
CN
CGN Power Co Ltd
SZSE:003816
185.3B CNY
34%
29%
12%
IN
Adani Power Ltd
NSE:ADANIPOWER
2.1T INR
45%
31%
24%
TH
Gulf Energy Development PCL
SET:GULF
672.3B THB
20%
17%
15%
CN
SDIC Power Holdings Co Ltd
SSE:600886
116.7B CNY
36%
32%
12%
CN
Huaneng Power International Inc
SSE:600011
101.1B CNY
15%
11%
3%
HK
China Resources Power Holdings Co Ltd
HKEX:836
105.6B HKD
0%
21%
14%

Return on Capital

Return on capital ratios give a sense of how well a company is using its capital (equity, assets, capital employed, etc.) to generate profits (operating income, net income, etc.). In simple words, these ratios show how much income is generated for each dollar of capital invested.

Show More Less

Return on Capital Comparison
Vistra Corp Competitors

Country Company Market Cap ROE ROA ROCE ROIC
US
Vistra Corp
NYSE:VST
54.6B USD
43%
6%
13%
9%
DE
Uniper SE
XETRA:UN01
562.9B EUR N/A N/A N/A N/A
SA
ACWA Power Co
SAU:2082
284.4B SAR
9%
3%
4%
4%
IN
NTPC Ltd
NSE:NTPC
3.2T INR
14%
5%
9%
6%
CN
China National Nuclear Power Co Ltd
SSE:601985
197B CNY
9%
2%
6%
4%
CN
CGN Power Co Ltd
SZSE:003816
185.3B CNY
9%
3%
7%
5%
IN
Adani Power Ltd
NSE:ADANIPOWER
2.1T INR
27%
13%
20%
15%
TH
Gulf Energy Development PCL
SET:GULF
672.3B THB
15%
4%
5%
5%
CN
SDIC Power Holdings Co Ltd
SSE:600886
116.7B CNY
11%
2%
8%
5%
CN
Huaneng Power International Inc
SSE:600011
101.1B CNY
6%
1%
7%
4%
HK
China Resources Power Holdings Co Ltd
HKEX:836
105.6B HKD
14%
4%
9%
6%

Free Cash Flow

Free cash flow (FCF) is the money a company has left over after paying its operating expenses and capital expenditures. The more free cash flow a company has, the more it can allocate to dividends, paying down debt, and growth opportunities.

If a company has a decreasing free cash flow, that is not necessarily bad if the company is investing in its growth.

Show More Less