 HRX
vs
S
S&P TSX Composite Index (Canada)
 HRX
HRX
Over the past 12 months, HRX has underperformed S&P TSX Composite Index (Canada), delivering a return of +2% compared to the S&P TSX Composite Index (Canada)'s +28% growth.
Stocks Performance
HRX vs S&P TSX Composite Index (Canada)

Performance Gap
HRX vs S&P TSX Composite Index (Canada)

Performance By Year
HRX vs S&P TSX Composite Index (Canada)

Compare the stock's returns with its benchmark index and competitors. Gain insights into its relative performance over time.
Heroux Devtek Inc
Glance View
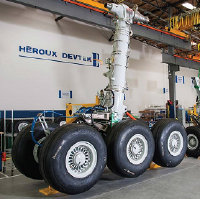
Héroux-Devtek, Inc. engages in the design, development, manufacture and overhaul of landing gear systems and components. The firm is engaged in the design, development, manufacture, repair and overhaul of aircraft landing gear, hydraulic and electromechanical actuators, custom ball screws and fracture-critical components. The Company’s service offerings include maintenance, repair and overhaul, spares provisioning and supply, warranty administration and support, technical publications, as well as on-site technical support and training. Its product support provides customers with a dedicated team for its range of products. Customers can count on the Company for spare parts availability, world-wide repair services, publications, product support, and issue resolution.


