` Comparison: DELT, HES - Alpha Spread

DELT
vs
HES

Over the past 12 months, DELT has underperformed HES, delivering a return of -18% compared to the HES's +11% growth.

Smart Verdict
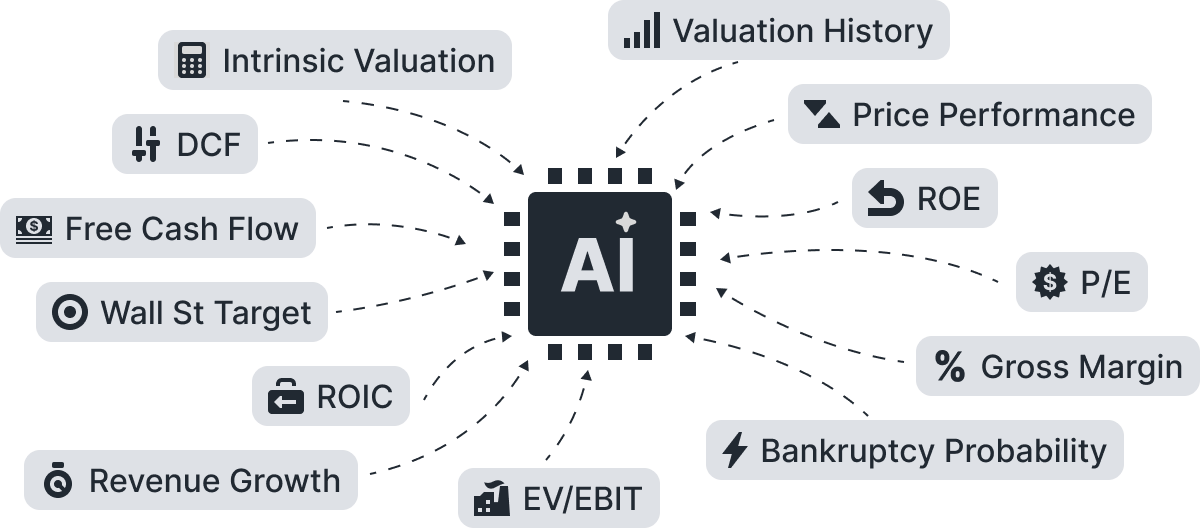
AI-Powered

Not Sure Which Stock Wins?
Let AI Decide.
DELT
HES
One-click summary across all key metrics.
Ranked results with clear takeaways.
No spreadsheets, no guesswork.
One-click summary across all key metrics.
Ranked results with clear takeaways.
No spreadsheets, no guesswork.
Start AI Comparison
Valuation
Growth
Profitability
Solvency
Comparing Valuation
Running a multi-layered valuation analysis to compare how attractive each stock is.
Comparing Growth
Financial growth, forecasts, volatility, and historical drawdowns.
Comparing Profitability
Margins, returns on capital, and the consistency of profitability.
Comparing Solvency
Debt levels, liquidity, interest coverage, and bankruptcy risk.
Summarizing...
We need a little more time to summarize the results

Valuation Comparison

DELT Intrinsic Value
Not Available
HES Intrinsic Value
195.94 USD
Undervaluation 24%
Intrinsic Value
Price
Company Last Price Intrinsic Value DCF Value Relative Value Wall St Target
Deltic Energy PLC
LSE:DELT
7.2 GBX
Hess Corp
NYSE:HES
148.97 USD
Valuation Scenario:
Bear Case
Base Case
Bull Case

Growth Comparison

Growth Over Time
DELT, HES

DELT
HES
Add Stock
Revenue
www.alphaspread.com
Company LTM Historical Growth Growth Streak % Positive Years Max Drawdown Volatility Forecasted Growth
3 Years 5 Years 10 Years 1 Year 3 Years
Deltic Energy PLC
Revenue
Hess Corp
Revenue

All metrics are calculated based on data from the last 10 years.

Profitability Comparison

Free Cash Flow
DELT, HES

DELT
HES
Add Stock
Free Cash Flow
www.alphaspread.com
Company LTM Average Historical Growth FCF Margin Conversion
3 Years 5 Years 3 Years 5 Years 10 Years
Deltic Energy PLC
LSE:DELT
Hess Corp
NYSE:HES
What is Free Cash Flow?

Gross Margin

DELT
0%
HES
77.6%
LTM 3Y Avg 5Y Avg 10Y Avg
Deltic Energy PLC
Hess Corp

Operating Margin

DELT
0%
HES
32%
LTM 3Y Avg 5Y Avg 10Y Avg
Deltic Energy PLC
Hess Corp

Net Margin

DELT
0%
HES
17.8%
LTM 3Y Avg 5Y Avg 10Y Avg
Deltic Energy PLC
Hess Corp

FCF Margin

DELT
0%
HES
8.9%
LTM 3Y Avg 5Y Avg 10Y Avg
Deltic Energy PLC
Hess Corp

ROE

DELT
-162.1%
HES
20.8%
LTM 3Y Avg 5Y Avg 10Y Avg
Deltic Energy PLC
Hess Corp

ROA

DELT
-136.5%
HES
8.6%
LTM 3Y Avg 5Y Avg 10Y Avg
Deltic Energy PLC
Hess Corp

ROIC

DELT
-44.9%
HES
11.6%
LTM 3Y Avg 5Y Avg 10Y Avg
Deltic Energy PLC
Hess Corp

ROCE

DELT
-23.4%
HES
17.4%
LTM 3Y Avg 5Y Avg 10Y Avg
Deltic Energy PLC
Hess Corp

Solvency Comparison

Balance Sheet Comparison

Stocks Performance

Stocks Performance
DELT, HES

Loading

Performance Gap
DELT, HES

Loading
DELT
HES
Difference
www.alphaspread.com

Performance By Year
DELT, HES

Loading
DELT
HES
Add Stock
Not Sure Which Stock Wins?
Let AI Decide
One-click summary across all key metrics.
Ranked results with clear takeaways.
No spreadsheets, no guesswork.
Start AI Comparison
Compare DELT to other stocks
Unlock Full Access to Alpha Spread
Create Free Account