
Eregli Demir ve Celik Fabrikalari TAS
IST:EREGL.E

Eregli Demir ve Celik Fabrikalari TAS
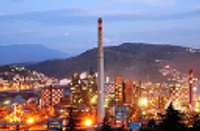
Eregli Demir ve Celik Fabrikalari TAS, commonly known as Erdemir, stands as a prominent pillar in Turkey's industrial landscape, nestled along the Black Sea coast. It was founded in 1965 and has grown to symbolize the nation's robust commitment to steel production. The company's operations are rooted in a sprawling integrated steel plant in Eregli, which acts as the heart of its operations. Here, Erdemir navigates the intricate processes of iron-making and steel-making, refining raw materials to produce a diverse portfolio of products. Its offerings range from hot and cold-rolled sheets, plates, to tin, chrome, and zinc-coated steels, catering to sectors as critical as automotive, manufacturing, and construction. This vertical integration, from raw material processing to finished product manufacturing, is a cornerstone of Erdemir's operational efficacy, ensuring control over quality and cost.
Erdemir's financial viability thrives on this comprehensive supply chain framework, driving its revenue through both domestic sales and growing exports. As the demand for steel surges globally, fueled by infrastructural developments and industrial advancements, Erdemir is strategically positioned to capitalize. Its competitive edge is further sharpened by continuous technological advancements and strategic partnerships, fostering an environment of innovation and sustainability. By investing in cutting-edge technology and adopting eco-friendly practices, Erdemir not only shaves production costs but also aligns with global sustainability trends. This blend of traditional metallurgical practices with modern efficiency mechanisms assures a steady revenue stream, reinforcing its status as one of Turkey's industrial champions.
Earnings Calls
Erdemir reported a solid Q1 2025, achieving $1.5 billion in revenue with $99 million EBITDA and a net profit of $12 million. Despite a temporary decline in capacity utilization to 79% due to maintenance, sales remained stable, and they anticipate total annual sales of 8 to 8.2 million tons. EBITDA per ton is expected to rise to between $90 and $100 in 2025. The company's capital expenditures will reach approximately $800-$850 million this year, while maintaining a net debt-to-EBITDA ratio below 3.3. With strategic investments, they foresee continued growth in their steel production capabilities.
Ladies and gentlemen, thank you for standing by. I'm Konstantinos, your Chorus Call operator. Welcome, and thank you for joining the Erdemir conference call and live webcast to present and discuss the First Quarter 2025 Financial Results. [Operator Instructions] The conference is being recorded. [Operator Instructions]
[Technical Difficulty] the necessary arrangements about the amounts and results of such information through its disclosure policy and has shared such policy with the public through the Erdemir website in accordance with the Capital Markets Board regulations. As stated in related policy, information contained in forward-looking statements, whether verbal or written, should not include unrealistic assumptions or forecasts. It should be noted that actual results could materially differ from estimates, taking into account the fact that they are not based on historical facts, but are driven from expectations, beliefs, plans, targets and other factors, which are beyond the control of our company.
[Technical Difficulty] Relations Director. Mrs. Ergin, you may now proceed.
Thank you very much, Konstantinos. Good afternoon, everyone. Welcome to our [Technical Difficulty] on our website, and you can also follow it through the webcast. Then at the end of this presentation, there is going to be a Q&A session as usual.
Let's take a look at coking coal, iron ore, scrap and HRC prices. Coking coal prices started at $197, dropped to as low as $166 and have currently risen to $191 per ton. Higher steelmaking profits and an increase in hot metal output supported the price increases. Operations at 2 major Australian mines have been suspended, which continues to raise concerns about short-term supply availability. Besides, there is uncertainty whether the price increases will be realized due to already high pulp inventories at mills and fluctuating steel prices caused by the ongoing tariff tensions. In the first quarter of 2025, iron ore prices fluctuated between $97 and $110 per ton. In early April, iron ore prices dropped rapidly from $105 to $95 due to uncertainty caused by the ongoing trade tensions between the U.S. and China.
However, as some signs of tariff relief emerged, the market stabilized and prices recovered to $100 level. This rebound was also supported by supply side factors, particularly the production cuts from major miners in the first quarter, mainly due to seasonal conditions. The scrap prices, which started the year at $346 increased to $383 by the end of the first quarter due to the recovery in rebar sales in both domestic and foreign markets and the expectations of price increases, which triggered stockpiling activities. However, in April, a sharp decline in prices was observed in the Turkish imported scrap market. Scrap prices have fallen to the level of $325. The abundance of scrap in the market and declining rebar prices have led to increases -- increased pressure on imported scrap contracts.
There are expectations that in the coming period, the demand for scrap in the U.S. domestic market will increase due to the impact of Trump tariffs and the supply of scrap from the U.S. will tighten. On the bottom right, we show HRC prices in Black Sea, China and South Europe. Due to weakening demand in China, Chinese HRC export prices have increasingly diverged downward compared to other global markets. China's export prices started the last quarter of the year at $470 per ton and continue to decline towards the end of the quarter. Under the current circumstances, prices have dropped to the level of $450 per ton.
In the European domestic hot-rolled coil market, it is noted that market activity has significantly increased compared to the beginning of the year. Prices have continued to rise due to the key factors such as the improvement in market expectations, the review of quotas for protection measures and the support of local prices by import prices due to concerns over quotas and taxes.
On Page 4, you will see the production consumption, export and import figures of Turkish steel market for the first 2 months of 2025. Turkish steel market maintained the high figures of the last year at the start of 2025, while consumption rose slightly by 2% and production increased by 1%, exports of steel products grew by 10% in volume during the first 2 months of the year and reaching 2.3 million tons. Imports are also increased by 24% to 3.1 million tons over the same period, mainly driven by higher semi-finished product imports. As a result, the export to import coverage ratio remained at 74%. The tariffs imposed by Trump on steel imports have the potential to positively impact Turkish steel producers in the long term.
As you all know, in March, Trump removed exemptions on steel tariffs to countries such as Canada, Mexico, EU countries and South Korea, which together accounted for 80% of the total steel imports to the U.S. With the removal of these exemptions, Turkish steel manufacturers now have an equal access to the U.S. market compared to the other countries, opening up new opportunities and potentially increasing export volumes to this key market. Additionally, a recent review of EU steel safeguard quotas has been conducted, and the conditions have been further tightened. When evaluating the quota outlook for HRC products, Turkey remains positioned as the largest quota holder and continues to be regarded as a primary import source.
So let's take a look at the financial results and the operational metrics. On Page 6, you will see the brief summary of our 3-month results. We achieved $1.5 billion revenue. Also, we generated $99 million EBITDA and $12 million net profit.
On Page 7, you will see the operational indicators of our company. The results achieved in the first quarter for sales and production are in line with our expectations. The capacity utilization ratio has decreased to 79%. However, this decline is entirely due to the planned maintenance activities in Erdemir plant. And there are no negative reflection in sales figures, as you can see. Therefore, despite the temporary decrease in capacity utilization, we have maintained our sales tonnage in line with historical averages. So as we shared in the last quarter -- in the last quarter's call, we expect total sales to be between 8 million and 8.2 million tons in 2025.
So let's take a look at the segmental breakdown of domestic sales and export volumes in Page 8. As you can see from the pie charts, there has been a slight change between the sectors when we compare to last year's breakdown. There has been a transition from general manufacturing and auto to pipe and profile and distribution chains on a percentage basis. We see similar changes between sectors in the long products, although its share in total sales is relatively small. We achieved an export volume of 422,000 tons, representing a 22% export share in total sales. This figure, 22% is the highest export rate in our history despite the challenging market conditions. Although our main focus is still domestic market, we are also increasing the export share due to the attractive demand or good prices in the export market.
On Page 9, you can find breakdown of revenue for domestic and export sales. 72% of revenue -- total revenue comes from domestic sales in line with domestic volume. We generated $51 EBITDA per ton in 3 months. As we shared in the last quarter's call, in 2025, we expect to see between $90 per ton and $100 per ton due to the better outlook in the steel sector in the second half of the year. Despite import pressure in the domestic market, we achieved to generate $99 million EBITDA and $12 million net profit in the first quarter.
On Page 10, we can see how we reached to net profit from EBITDA. One of the largest item was depreciation, which was $63 million in 3 months. The other major item in this chart was financial expenses of $62 million. And after other expenses, net profit was $12 million. The inventory provision release of [ $15 million ] is not included in EBITDA calculation since it is a one-off adjustment. While calculating the net profit, [ $50 million ] of consolidation classification arises from additional inventory provision release. In the graph below, you can see EBITDA to change in cash bridge. Our net working capital decreased compared to the fourth quarter due to decreasing inventories and value-added tax receivables. Also, we spent around $311 million to capital expenditures in 3 months. This amount also includes advances paid for the capital expenditures and sale of commercial offices for investment properties as well that you will see the difference between the CapEx paid in Page 13 and this one. In Q1 2025, there was no cash outflow from tax payments.
On Page 11, you will see historical trend of financial borrowings and net debt. As you can see in the financial borrowings chart, the share of short-term debt in total debt decreased to 22% in Q1 with the support of $950 million Eurobond issuance. When we look at 2025, our net working capital decreased due to decreasing inventories and value-added tax receivables. Despite high capital expenditures, we succeed to keep net debt-to-EBITDA below 3 multiplier in the first quarter, and we expect to keep net debt-to-EBITDA ratio below 3.3 multiplier for 2025.
Slide 12 represents our cost of sales breakdown. There is no significant change in our cost breakdown since Q4. The composition of iron ore and coking coal in raw material costs have changed and the percentage of coking coal costs decreased in the raw material basket, which is in line with the trends in raw material markets.
Page 13 represents the historical capital expenditures. The total CapEx was $1.1 billion in 2024 and $311 million in the first quarter of 2025. The new first blast furnace in Isdemir and #4 coke battery in Erdemir will be commissioned in the second quarter of this year. Other than these investments such as pelletizing plants, solar power plants and energy efficiency investments are included in the CapEx figure of 2025. We expect that CapEx will be around $800 million, $850 million in 2025 with maintenance and other ongoing investments. Maintenance will be around [ $50 million, $80 million ] per year as usual. As we announced last year, if the reserve in the gold mine is significant, it could rise up to $1 billion.
So Page 14. As you know, we announced our Net Zero Roadmap last year in January. We plan to spend $3.2 billion for transformational investment of Erdemir and Isdemir by the end of 2030. 78% of that amount will be sourced externally. Erdemir and Isdemir crude steel capacity will reach 30 million tonnes by 2030.
Now, we may continue with the Q&A session. We will be delighted to answer your questions. Thank you for listening.
[Operator Instructions] [indiscernible] question comes from the line of Fairclough Jason with Bank of America.
A couple of quick ones from me. First, on the working capital. I'm just wondering if you could talk to how permanent this is? Is this something where you're going to need to rebuild that working capital later on this year? Or is this a new level of normal?
And then, I guess, the second question is, maybe you could talk a little bit about the production in sales in Q1. They did look a little bit light versus, let's say, last year. So any color would be really helpful.
Jason, so the net working capital level, we will maintain that level actually during the year. So it is a sustainable level for us. Sorry, I just missed your second question. Could you please repeat that?
Yes. So the first quarter steel production and steel sales looked a little bit light versus what they normally are. Maybe you could just give a little bit more color on why those were a little bit lower than, say, last year, yes?
Yes, sure. I mean, the production is less than the previous quarters because of the planned maintenance activities. But it has no effect, no impact on sales because they are planned, and we just prepared the flat -- the semi-finished goods before we started the maintenance activities. So it's a temporary situation. But as I mentioned, there is no negative impact on the sales figures. So we still keep our expectation of 8 million to 8.2 million tonnes of sales for the whole year.
Okay. Could I just follow up on the working capital, please? So the working capital, how much of this is a price effect and how much of this is a volume effect? So is it that you're running lower stockpiles? Or is it the price is lower? Or is it a little bit of both?
Around 40% comes from the price and the rest is because of the tonnage.
The next question comes from the line of Gabriel Alain with Morgan Stanley.
I have 2 questions from my side. Firstly, Idil, can you please tell us a bit more about this gold deposit? What have you learned in the last few months on the size, on the CapEx budget? How much confidence do you have in your ability to spend extra $200 million or so on CapEx to progress that project? Any color there? That's my first question. It will be much appreciated.
Well, actually, we are still working on it. So there isn't any new news from the gold mine. But we mentioned that normally, we are expecting CapEx will be around $800 million, $850 million in 2025. But if the reserve in gold mines is significant, it could rise up to $1 billion. So that's in general, let's say, CapEx only for this year. This is what we are expecting. But our reserve determination studies continue. So we will make an announcement as soon as the report -- UMREK report. UMREK is the National Resources and Reserves Reporting Committee. So, as soon as the report is released, we will make an announcement.
Do you have any rough estimates on time frames? Is it 2 months? Is it 1 year?
Unfortunately, sorry.
Okay. No problem. And my second question is on the second quarter EBITDA. Do you mind giving us the building blocks for the EBITDA for the second quarter in terms of price costs and then volumes? How should we think about the evolution of your EBITDA Q-on-Q?
Actually, we are expecting very similar EBITDA numbers for the second quarter. There might be a slight increase in the prices. But again, it will be quite similar to the first quarter.
The next question comes from the line of Jones Andrew with UBS.
A question on the export activity. I mean, clearly, the EU tightening import restrictions. I guess, obviously, we've seen what's happening in the U.S., the 25% that Turkey faced on selling to the U.S. is still there. So I'm curious how your export activity is evolving in the current market conditions? Are you potentially looking at shipping more to the U.S., given, I guess, tariffs for you haven't changed and price levels are higher? Or a view -- is the plan to sort of sell more domestically? What's the -- have your sales plans changed in light of all the tariff activity?
Andy, so this quarter was the highest percentage of our export in total sales. And we believe that the Turkish steel producers have some kind of opportunity, both in U.S. market and EU market. As I shared during the presentation, I mean, right now, there is an equal access to the U.S. market because they removed the exemptions on steel tariffs in Section 232. And also, we are the -- we have the largest quota in EU. So right now, we believe that there are some opportunities for the Turkish steel producer in generally. But what we are doing, of course, we are trying to involve with every export market, including U.S. And of course, EU is always our #1 export market. So we are trying to increase our share in these markets.
Okay. No, that's clear. And just on the second quarter, I mean, you mentioned similar levels of EBITDA, potentially prices increasing slightly. I mean, I would have thought the raw materials would provide a bit of a tailwind into the second quarter. Do you see much cost relief there? And I mean, could -- if you do have some increase in pricing, could that provide some risk to the upside on the EBITDA for 2Q?
Okay. So in the second quarter, as I shared, there are 2 new investments that we will commission. So this transition process might have some kind of additional cost. So that's the reason we expect similar EBITDA, although we are expecting slightly higher sales prices.
The next question comes from the line of Ive Erica with MetLife Investment Management.
As a follow-up to working capital, when you say same level, so shall I expect an inflow of $380 million for the year?
Actually, we are not expecting any significant change. So what we announced as working capital in the first quarter will be very similar when we finish the year actually.
Yes. But still, you had an inflow of $380 million in first quarter. So shall I assume that -- how you will finish the year, with an inflow or a neutral position, basically 0?
Neutral position, actually.
Excuse me, could you repeat?
Neutral position.
Okay. So basically, you expect some outflow in the following quarters. So you will have basically flat 0 working capital movement.
Actually, what we are saying that the number that we have in the first quarter as net working capital will be very similar at the end of the year. So that's why we are not expecting any significant movement in net working capital.
Okay. And I might have missed it. What is your expectation of EBITDA per tonne for the year? Have you changed guidance at all? Or you confirmed the $90 to $100 per tonne?
Erica, we haven't changed the expectation on EBITDA per tonne. So, as we announced in the last quarter's call, as you mentioned also, $90 to $100 EBITDA per tonne expectation, we still keep that level.
And then, when you say in Q2 that you expect a similar level of EBITDA in terms of absolute number or EBITDA per tonne?
Actually, both. Most probably the tonnage -- sales tonnage will be similar, around 1.9 million to 2 million tonnes. This is actually our yearly number also, 800 million (sic) [ 8 million ] to 8.2 million tonnes. So each quarter, we expect to sell 1.9 million to 2 million tonnes. So most probably, the sales tonnage will be similar. So both EBITDA and EBITDA per tonne will be similar with the first quarter.
And also, one other thing I want to ask you is on interest paid. I saw a sizable outflow, $160 million compared to $70 million in the previous year for the first quarter of the year. So I was wondering what is the $160 million due to?
Actually, we had Eurobond interest payments in Q1. I think you are mentioning this number, right?
Yes, the interest paid in the cash flow statement, so $159 million, which was quite high. That's the one.
Yes, that's correct.
Okay. And for the year, may I know how much interest payment do you expect?
Sorry, excuse me, I just couldn't understand your last question.
Yes. Basically, given that you paid $160 million in the first quarter, how much...
We don't have any payment in the second quarter.
Ladies and gentlemen, there are no further questions at this time. I will now turn the conference over to Ms. Ergin for any closing comments. Thank you. Ms. Ergin, can you hear us?
Yes, I can.
There are no further questions at this time. The floor back to you, Mr. Ergin. Thank you.
Thank you very much for joining us. We hope to meet you again in our second quarter call. Have a nice day. Thank you.
Ladies and gentlemen, the conference has now concluded, and you may disconnect your telephone. Thank you for calling. Have a good afternoon.