


Rupert Resources Ltd
XTSX:RUP


| US |

|
Johnson & Johnson
NYSE:JNJ
|
Pharmaceuticals
|
| US |

|
Berkshire Hathaway Inc
NYSE:BRK.A
|
Financial Services
|
| US |

|
Bank of America Corp
NYSE:BAC
|
Banking
|
| US |

|
Mastercard Inc
NYSE:MA
|
Technology
|
| US |

|
UnitedHealth Group Inc
NYSE:UNH
|
Health Care
|
| US |

|
Exxon Mobil Corp
NYSE:XOM
|
Energy
|
| US |

|
Pfizer Inc
NYSE:PFE
|
Pharmaceuticals
|
| US |

|
Palantir Technologies Inc
NYSE:PLTR
|
Technology
|
| US |

|
Nike Inc
NYSE:NKE
|
Textiles, Apparel & Luxury Goods
|
| US |

|
Visa Inc
NYSE:V
|
Technology
|
| CN |

|
Alibaba Group Holding Ltd
NYSE:BABA
|
Retail
|
| US |

|
JPMorgan Chase & Co
NYSE:JPM
|
Banking
|
| US |

|
Coca-Cola Co
NYSE:KO
|
Beverages
|
| US |

|
Walmart Inc
NYSE:WMT
|
Retail
|
| US |

|
Verizon Communications Inc
NYSE:VZ
|
Telecommunication
|
| US |

|
Chevron Corp
NYSE:CVX
|
Energy
|

Utilize notes to systematically review your investment decisions. By reflecting on past outcomes, you can discern effective strategies and identify those that underperformed. This continuous feedback loop enables you to adapt and refine your approach, optimizing for future success.
Each note serves as a learning point, offering insights into your decision-making processes. Over time, you'll accumulate a personalized database of knowledge, enhancing your ability to make informed decisions quickly and effectively.
With a comprehensive record of your investment history at your fingertips, you can compare current opportunities against past experiences. This not only bolsters your confidence but also ensures that each decision is grounded in a well-documented rationale.
Do you really want to delete this note?
This action cannot be undone.

| 52 Week Range |
N/A
N/A
|
| Price Target |
|
We'll email you a reminder when the closing price reaches CAD.
Choose the stock you wish to monitor with a price alert.
|
|
Johnson & Johnson
NYSE:JNJ
|
US |
|
|
Berkshire Hathaway Inc
NYSE:BRK.A
|
US |
|
|
Bank of America Corp
NYSE:BAC
|
US |
|
|
Mastercard Inc
NYSE:MA
|
US |
|
|
UnitedHealth Group Inc
NYSE:UNH
|
US |
|
|
Exxon Mobil Corp
NYSE:XOM
|
US |
|
|
Pfizer Inc
NYSE:PFE
|
US |
|
|
Palantir Technologies Inc
NYSE:PLTR
|
US |
|
|
Nike Inc
NYSE:NKE
|
US |
|
|
Visa Inc
NYSE:V
|
US |
|
|
Alibaba Group Holding Ltd
NYSE:BABA
|
CN |
|
|
JPMorgan Chase & Co
NYSE:JPM
|
US |
|
|
Coca-Cola Co
NYSE:KO
|
US |
|
|
Walmart Inc
NYSE:WMT
|
US |
|
|
Verizon Communications Inc
NYSE:VZ
|
US |
|
|
Chevron Corp
NYSE:CVX
|
US |
This alert will be permanently deleted.
Operating Margin
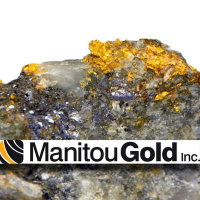
Rupert Resources Ltd
Operating Margin represents how efficiently a company is able to generate profit through its core operations.
Higher ratios are generally better, illustrating the company is efficient in its operations and is good at turning sales into profits.
Operating Margin Across Competitors
| Country | Company | Market Cap |
Operating Margin |
||
|---|---|---|---|---|---|
| CA |
|
Rupert Resources Ltd
XTSX:RUP
|
915.6m CAD | N/A | |
| RU |
P
|
Polyus PJSC
LSE:PLZL
|
70.4T USD |
51%
|
|
| ZA |
G
|
Gold Fields Ltd
JSE:GFI
|
705.8B Zac |
53%
|
|
| ZA |
H
|
Harmony Gold Mining Company Ltd
JSE:HAR
|
231.4B Zac |
28%
|
|
| CN |

|
Zijin Mining Group Co Ltd
SSE:601899
|
1T CNY |
19%
|
|
| US |

|
Newmont Corporation
NYSE:NEM
|
123.3B USD |
43%
|
|
| AU |
G
|
Greatland Gold PLC
ASX:GGP
|
165B AUD |
44%
|
|
| CA |

|
Agnico Eagle Mines Ltd
TSX:AEM
|
135.4B CAD |
49%
|
|
| CA |

|
Barrick Gold Corp
TSX:ABX
|
115B CAD |
45%
|
|
| CA |

|
Barrick Mining Corp
F:ABR0
|
71.6B EUR |
45%
|
|
| CA |

|
Wheaton Precious Metals Corp
TSX:WPM
|
81B CAD |
58%
|
Rupert Resources Ltd
Glance View
Rupert Resources Ltd. engages in the acquisition and exploration of mineral properties in Finland. The company is headquartered in Toronto, Ontario and currently employs 22 full-time employees. The firm is engaged in the acquisition and exploration of mineral properties in Canada. The company is seeking out viable mineral exploration and evaluation opportunities and its primary projects located in Finland. The firm's exploration and evaluation assets include Rupert Lapland Project, Gold Centre property, Surf Inlet Project and Hirsikangas deposit. The Rupert Lapland Project is located in the Central Lapland Greenstone Belt in Northern Finland consisting of Ikkari Discovery, permitted Pahtavaara mine and mill within a total land package of approximately 595 square kilometers. The Gold Centre property lies to the southeast and within the shadow of the headframe of Red Lake Mine. The operating property consists of approximately 258 hectares made up of one lease containing 16 claims. The Hirsikangas deposit in Central Finland is a Palaeoproterozoic orogenic gold deposit located on a crustal scale shear zone.
See Also
Operating Margin represents how efficiently a company is able to generate profit through its core operations.
Higher ratios are generally better, illustrating the company is efficient in its operations and is good at turning sales into profits.
Based on Rupert Resources Ltd's most recent financial statements, the company has Operating Margin of 0%.