
Barrick Gold Corp
TSX:ABX

Decide at what price you'd be comfortable buying and we'll help you stay ready.

|
Johnson & Johnson
NYSE:JNJ
|
US |

|
Berkshire Hathaway Inc
NYSE:BRK.A
|
US |

|
Bank of America Corp
NYSE:BAC
|
US |

|
Mastercard Inc
NYSE:MA
|
US |

|
UnitedHealth Group Inc
NYSE:UNH
|
US |

|
Exxon Mobil Corp
NYSE:XOM
|
US |

|
Pfizer Inc
NYSE:PFE
|
US |

|
Nike Inc
NYSE:NKE
|
US |

|
Visa Inc
NYSE:V
|
US |

|
Alibaba Group Holding Ltd
NYSE:BABA
|
CN |

|
JPMorgan Chase & Co
NYSE:JPM
|
US |

|
Coca-Cola Co
NYSE:KO
|
US |

|
Verizon Communications Inc
NYSE:VZ
|
US |

|
Chevron Corp
NYSE:CVX
|
US |

|
Walt Disney Co
NYSE:DIS
|
US |

|
PayPal Holdings Inc
NASDAQ:PYPL
|
US |
 Barrick Gold Corp
Net Change in Cash
Barrick Gold Corp
Net Change in Cash
Barrick Gold Corp
Net Change in Cash Peer Comparison
Competitors Analysis
Latest Figures & CAGR of Competitors
| Company | Net Change in Cash | CAGR 3Y | CAGR 5Y | CAGR 10Y | ||
|---|---|---|---|---|---|---|
|
|
Barrick Gold Corp
TSX:ABX
|
Net Change in Cash
$2.6B
|
CAGR 3-Years
N/A
|
CAGR 5-Years
7%
|
CAGR 10-Years
N/A
|
|

|
Wheaton Precious Metals Corp
TSX:WPM
|
Net Change in Cash
$335.4m
|
CAGR 3-Years
-11%
|
CAGR 5-Years
31%
|
CAGR 10-Years
N/A
|
|
|
Alamos Gold Inc
TSX:AGI
|
Net Change in Cash
$295.9m
|
CAGR 3-Years
N/A
|
CAGR 5-Years
51%
|
CAGR 10-Years
4%
|
|

|
Kinross Gold Corp
TSX:K
|
Net Change in Cash
$1.1B
|
CAGR 3-Years
N/A
|
CAGR 5-Years
12%
|
CAGR 10-Years
34%
|
|

|
Franco-Nevada Corp
TSX:FNV
|
Net Change in Cash
-$780.4m
|
CAGR 3-Years
N/A
|
CAGR 5-Years
N/A
|
CAGR 10-Years
-6%
|
|

|
Agnico Eagle Mines Ltd
TSX:AEM
|
Net Change in Cash
$1.9B
|
CAGR 3-Years
60%
|
CAGR 5-Years
89%
|
CAGR 10-Years
N/A
|
|
Barrick Gold Corp
Glance View
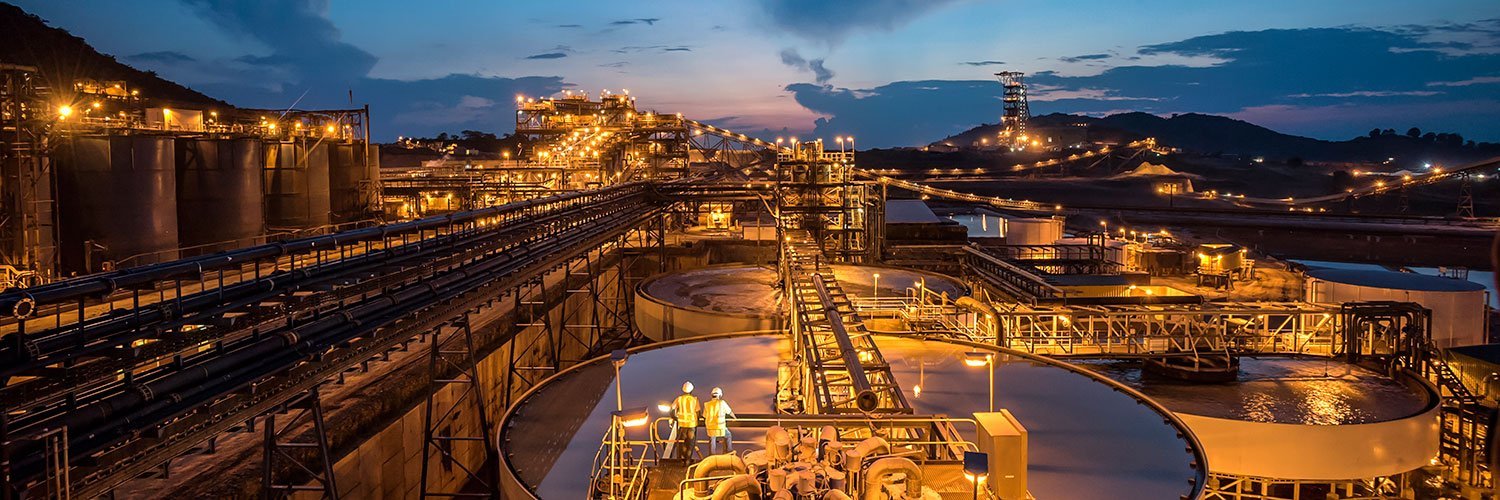
Barrick Gold Corporation, a titan in the gold mining industry, was founded in 1983 by Canadian entrepreneur Peter Munk. From its modest beginnings, Barrick swiftly ascended, driven by Munk’s strategic vision and a series of successful acquisitions, transforming it into the world's second-largest gold producer. Central to Barrick's operations is the exploration, mining, and production of gold and copper, commodities that are often seen as both investments and industrial necessities. With mines and projects situated in prolific mining territories like North and South America, Africa, and the Middle East, Barrick's global presence is a testament to its ambitious reach and operational resilience. Earning its revenues primarily through the sale of gold and copper, Barrick Gold embraces efficiencies and innovations to navigate the volatile commodity markets. The company implements cutting-edge technological advancements and sustainable practices, aiming to reduce operational costs and environmental impact while maximizing yields. Barrick thrives by continuously optimizing its portfolio, focusing on tier-one gold assets and maintaining a robust pipeline of future projects. By balancing its current mining operations with an eye toward future growth, Barrick positions itself as a steadfast player in the fluctuating landscape of precious metals.
See Also
What is Barrick Gold Corp's Net Change in Cash?
Net Change in Cash
2.6B
USD
Based on the financial report for Dec 31, 2025, Barrick Gold Corp's Net Change in Cash amounts to 2.6B USD.
What is Barrick Gold Corp's Net Change in Cash growth rate?
Net Change in Cash CAGR 5Y
7%
