
Ollie's Bargain Outlet Holdings Inc
NASDAQ:OLLI

Decide at what price you'd be comfortable buying and we'll help you stay ready.

|
CDA SA
F:6LC
|
PL |
|
C
|
Chime Financial Inc
NASDAQ:CHYM
|
US |

|
Alarum Technologies Ltd
NASDAQ:ALAR
|
IL |

|
OVB Holding AG
XETRA:O4B
|
DE |

|
Simplicity Holding Ltd
HKEX:8367
|
HK |

|
Korea Shipbuilding & Offshore Engineering Co Ltd
KRX:009540
|
KR |

|
Sugita Ace Co Ltd
TSE:7635
|
JP |

|
Infinity Logistics and Transport Ventures Ltd
HKEX:1442
|
MY |
Net Margin
Net Margin shows how much profit a company keeps from each dollar of sales after all expenses, including taxes and interest. It reflects the company`s overall profitability.
Net Margin shows how much profit a company keeps from each dollar of sales after all expenses, including taxes and interest. It reflects the company`s overall profitability.
Peer Comparison
| Country | Company | Market Cap |
Net Margin |
||
|---|---|---|---|---|---|
| US |

|
Ollie's Bargain Outlet Holdings Inc
NASDAQ:OLLI
|
5.6B USD |
Loading...
|
|
| AU |

|
Wesfarmers Ltd
ASX:WES
|
86.9B AUD |
Loading...
|
|
| US |

|
Target Corp
NYSE:TGT
|
56.2B USD |
Loading...
|
|
| CA |

|
Dollarama Inc
TSX:DOL
|
48.3B CAD |
Loading...
|
|
| US |

|
Dollar General Corp
NYSE:DG
|
26.4B USD |
Loading...
|
|
| US |

|
Dollar Tree Inc
NASDAQ:DLTR
|
20.4B USD |
Loading...
|
|
| JP |

|
Pan Pacific International Holdings Corp
TSE:7532
|
2.8T JPY |
Loading...
|
|
| JP |

|
Ryohin Keikaku Co Ltd
TSE:7453
|
2T JPY |
Loading...
|
|
| CA |

|
Canadian Tire Corporation Ltd
TSX:CTC.A
|
10.3B CAD |
Loading...
|
|
| CN |
M
|
MINISO Group Holding Ltd
HKEX:9896
|
39.9B HKD |
Loading...
|
|
| AU |

|
Harvey Norman Holdings Ltd
ASX:HVN
|
6B AUD |
Loading...
|
Market Distribution
| Min | -4 418 600% |
| 30th Percentile | -9.6% |
| Median | 3.1% |
| 70th Percentile | 11.3% |
| Max | 1 135 400% |
Other Profitability Ratios
Ollie's Bargain Outlet Holdings Inc
Glance View
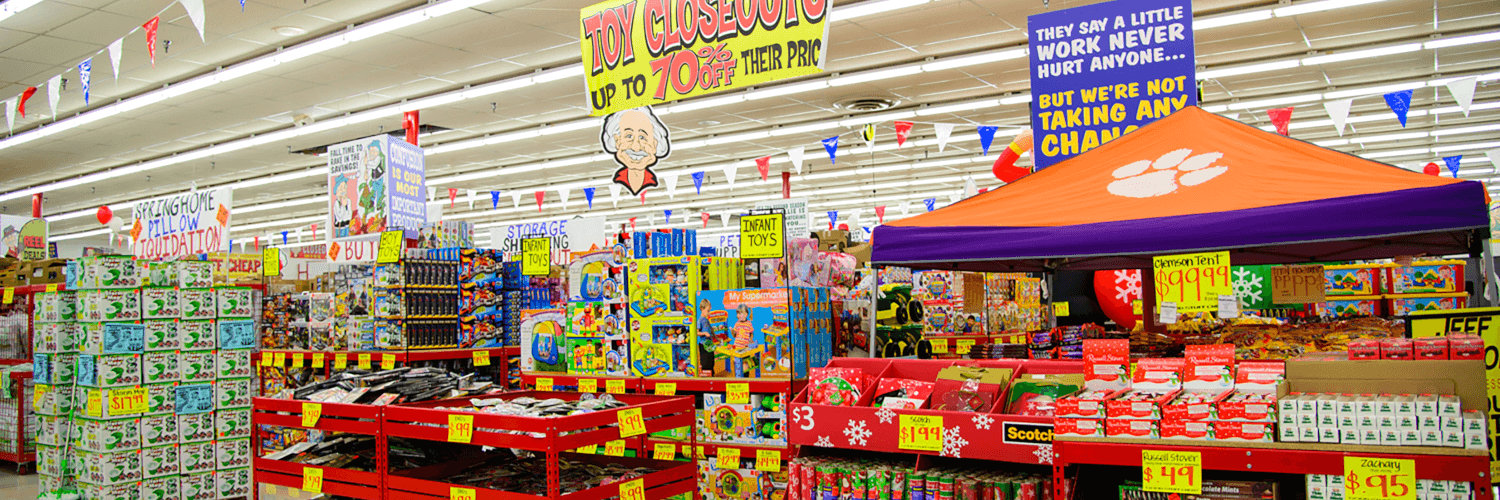
Ollie's Bargain Outlet Holdings Inc., a well-regarded player in the retail discount sector, has built its business model upon the principle of offering customers a "Good Stuff Cheap" shopping experience. Its stores resemble treasure troves, where customers explore overflowing aisles in search of high-quality name-brand merchandise at significantly discounted prices. The company thrives on its opportunistic purchasing strategy, acquiring excess, discontinued, or overstocked inventory from various suppliers, manufacturers, and other retailers. By consistently buying goods at below-market rates, Ollie's passes these savings on to customers, fostering a loyal following eager to discover deals on items ranging from housewares to toys, flooring to food. A crucial element of Ollie’s success lies in its no-frills store environment and straightforward business operations, enabling it to maintain operational efficiency and avoid unnecessary costs. Eschewing costly grand displays and heavy marketing expenditures, Ollie’s focuses on leveraging word-of-mouth endorsement and customer curiosity to draw traffic to its outlets. Its efficient supply chain management ensures that despite the variable nature of surplus goods, stores are well-stocked. By maintaining strategic focus on controlling costs while consistently offering competitive pricing, Ollie's has carved out a niche in the competitive retail landscape, appealing to value-oriented shoppers and securing a steady revenue stream as it expands its footprint across the United States.
See Also
Net Margin is calculated by dividing the Net Income by the Revenue.
The current Net Margin for Ollie's Bargain Outlet Holdings Inc is 9.1%, which is above its 3-year median of 8.5%.
Over the last 3 years, Ollie's Bargain Outlet Holdings Inc’s Net Margin has increased from 5.6% to 9.1%. During this period, it reached a low of 5.6% on Jan 28, 2023 and a high of 9.2% on Nov 2, 2024.
