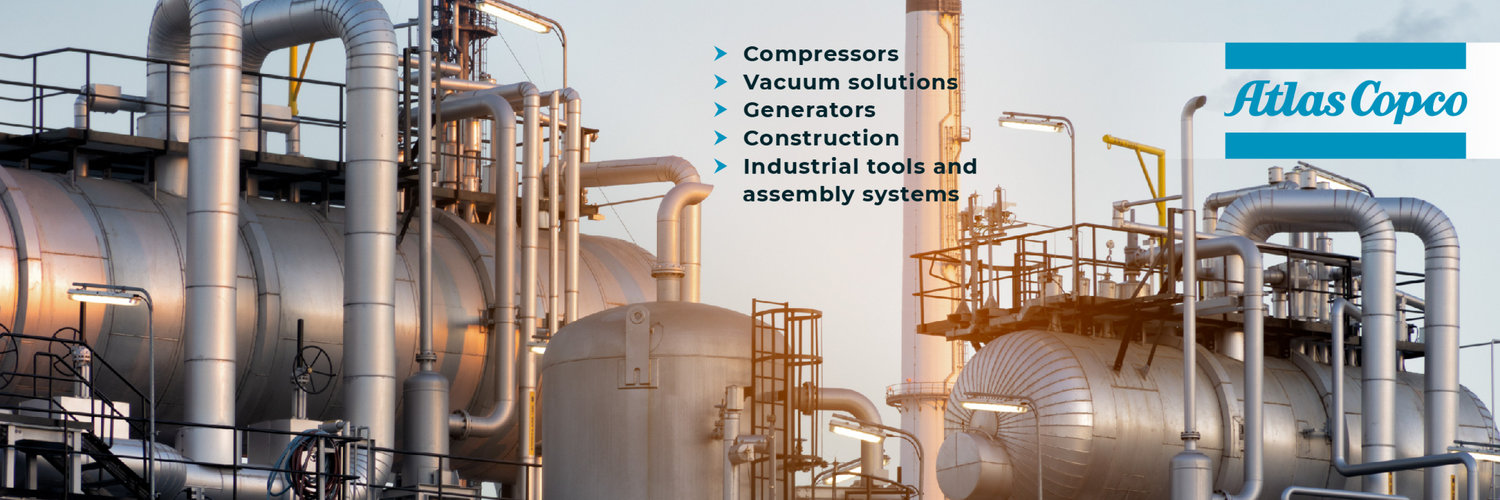
Atlas Copco AB
STO:ATCO A
Atlas Copco AB
STO:ATCO A
Price:
162.75
SEK
2.97%
Market Closed
Market Cap:
kr793.9B

Add Note
Add Target
Capture your thoughts and set a target
Decide at what price you'd be comfortable buying and we'll help you stay ready.
Based on
Margin of Safety
0%
10%
20%
30%
40%
50%
Your Price Target
Linked to
current price
· In Buy Zone
Loading
Note attached
Choose the stock you wish to monitor with a price target
Recently Viewed

|
Atlas Copco AB
STO:ATCO A
|
SE |

|
Apiam Animal Health Ltd
ASX:AHX
|
AU |
|
I
|
Insight Acquisition Corp
NASDAQ:INAQ
|
US |

|
Full Speed Inc
TSE:2159
|
JP |

|
IMP Powers Ltd
NSE:INDLMETER
|
IN |
|
C
|
Cairn Homes PLC
LSE:CRN
|
IE |

|
EPR Properties
NYSE:EPR
|
US |
|
R
|
Reply SpA
OTC:RPYTF
|
IT |

|
Dynavision Ltd
BSE:517238
|
IN |

|
Thomson Resources Ltd
ASX:TMZ
|
AU |

|
RE&S Holdings Ltd
SGX:1G1
|
SG |
|
C
|
Capro Corp
KRX:006380
|
KR |
|
R
|
Richelieu Hardware Ltd
TSX:RCH
|
CA |

|
Sivers Semiconductors AB
STO:SIVE
|
SE |

|
IDEC Corp
TSE:6652
|
JP |
|
V
|
Viet Nam Fumigation JSC
VN:VFG
|
VN |
|
B
|
Beijing Aerospace Changfeng Co Ltd
SSE:600855
|
CN |

|
Washington Hotel Corp
TSE:4691
|
JP |

|
Zoom Video Communications Inc
NASDAQ:ZM
|
US |

|
Chuo Warehouse Co Ltd
TSE:9319
|
JP |

|
SoftBank Group Corp
TSE:9984
|
JP |
|
Blink Charging Co
NASDAQ:BLNK
|
US |
|
Thermal Energy International Inc
XTSX:TMG
|
CA |
|
D
|
Daios Plastics SA
ATHEX:DAIOS
|
GR |
Relative Value
The Relative Value of one
ATCO A
stock under the Base Case scenario is
hidden
SEK.
Compared to the current market price of 162.75 SEK,
Atlas Copco AB
is
hidden
.
Relative Value is the estimated value of a stock based on various valuation multiples like P/E and EV/EBIT ratios. It offers a quick snapshot of a stock's valuation in relation to its peers and historical norms.
Relative Valuation FAQ:
ATCO A Relative Value
HIDDEN
Multiples Across Competitors
ATCO A Competitors Multiples
Atlas Copco AB Competitors
Atlas Copco AB Competitors
All Countries
| Market Cap | P/S | P/E | EV/EBITDA | EV/EBIT | ||||
|---|---|---|---|---|---|---|---|---|
| SE |
|
Atlas Copco AB
STO:ATCO A
|
769.4B SEK | 4.7 | 29.9 | 18.4 | 23.5 | |
| JP |
F
|
Fujitec Co Ltd
TSE:6406
|
2 720 795.8T JPY | 0 | 0 | 12.8 | 15.8 | |
| JP |
I
|
Ishii Iron Works Co Ltd
TSE:6362
|
304.2T JPY | 28 119.8 | 363 670.8 | 171 820.3 | 210 169.2 | |
| JP |
S
|
Star Micronics Co Ltd
TSE:7718
|
48T JPY | 1.4 | 29.8 | 8.2 | 13.1 | |
| US |

|
Parker-Hannifin Corp
NYSE:PH
|
114.3B USD | 5.6 | 32.3 | 22.8 | 27.5 | |
| JP |

|
Freund Corp
TSE:6312
|
16.9T JPY | 607.7 | 8 494.3 | 4 698.9 | 5 768.3 | |
| JP |

|
Mitsubishi Heavy Industries Ltd
TSE:7011
|
15.2T JPY | 3.2 | 54 | 26.3 | 38.6 | |
| US |

|
Illinois Tool Works Inc
NYSE:ITW
|
75.8B USD | 4.7 | 24.7 | 17.8 | 19.5 | |
| US |

|
Barnes Group Inc
NYSE:B
|
63.1B USD | 3.7 | 12.6 | 6.1 | 7.6 | |
| SE |

|
Sandvik AB
STO:SAND
|
419.1B SEK | 3.6 | 29.2 | 15.7 | 21.1 | |
| CH |

|
Schindler Holding AG
SIX:SCHP
|
28B CHF | 2.6 | 27.9 | 16.8 | 20.8 |
P/S Multiple
P/E Multiple
EV/EBITDA Multiple
EV/EBIT Multiple
