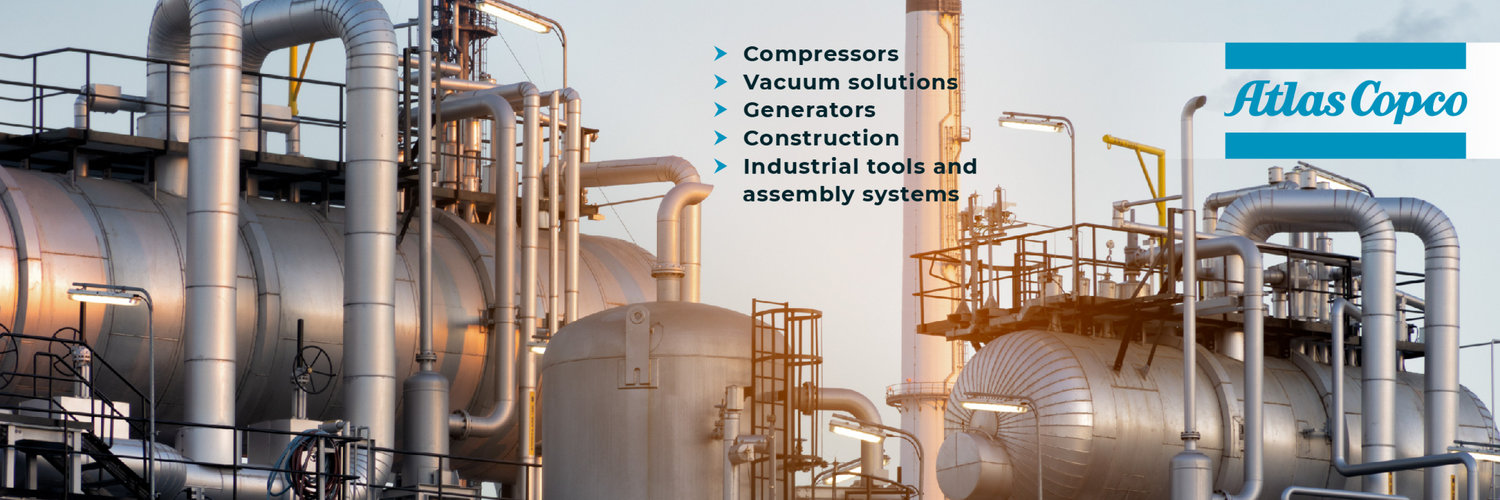
Atlas Copco AB
STO:ATCO A

Decide at what price you'd be comfortable buying and we'll help you stay ready.

|
Atlas Copco AB
STO:ATCO A
|
SE |
|
Magillem Design Services SA
PAR:MLMGL
|
FR |

|
DAVIDsTEA Inc
XTSX:DTEA
|
CA |
|
S
|
Sinolink Securities Co Ltd
SSE:600109
|
CN |
|
C
|
CPM Group Ltd
HKEX:1932
|
HK |

|
Tobu Railway Co Ltd
TSE:9001
|
JP |

|
Hengtai Securities Co Ltd
HKEX:1476
|
CN |
|
G
|
General Dynamics Corp
XETRA:GDX
|
US |
|
E
|
Everest Global PLC
LSE:EVST
|
UK |
Profitability Summary
Atlas Copco AB's profitability score is hidden . We take all the information about a company's profitability (such as its margins, capital efficiency, free cash flow generating ability, and more) and consolidate it into one single number - the profitability score. The higher the profitability score, the more profitable the company is.
Profitability Score
We take all the information about a company's profitability (such as its margins, capital efficiency, free cash flow generating ability, and more) and consolidate it into one single number - the profitability score. The higher the profitability score, the more profitable the company is.
We take all the information about a company's profitability (such as its margins, capital efficiency, free cash flow generating ability, and more) and consolidate it into one single number - the profitability score. The higher the profitability score, the more profitable the company is.
Profitability Score
Margins
Earnings Waterfall
Atlas Copco AB
Margins Comparison
Atlas Copco AB Competitors
| Country | Company | Market Cap |
Gross Margin |
Operating Margin |
Net Margin |
||
|---|---|---|---|---|---|---|---|
| SE |
|
Atlas Copco AB
STO:ATCO A
|
890.3B SEK |
Loading...
|
Loading...
|
Loading...
|
|
| US |

|
Parker-Hannifin Corp
NYSE:PH
|
121.6B USD |
Loading...
|
Loading...
|
Loading...
|
|
| US |

|
Illinois Tool Works Inc
NYSE:ITW
|
76.3B USD |
Loading...
|
Loading...
|
Loading...
|
|
| US |

|
Ingersoll Rand Inc
NYSE:IR
|
32.6B USD |
Loading...
|
Loading...
|
Loading...
|
|
| US |

|
Dover Corp
NYSE:DOV
|
29.1B USD |
Loading...
|
Loading...
|
Loading...
|
|
| DE |

|
GEA Group AG
XETRA:G1A
|
10B EUR |
Loading...
|
Loading...
|
Loading...
|
|
| JP |
F
|
Fujitec Co Ltd
TSE:6406
|
2 720 795.8T JPY |
Loading...
|
Loading...
|
Loading...
|
|
| JP |
I
|
Ishii Iron Works Co Ltd
TSE:6362
|
304.2T JPY |
Loading...
|
Loading...
|
Loading...
|
|
| JP |
S
|
Star Micronics Co Ltd
TSE:7718
|
48T JPY |
Loading...
|
Loading...
|
Loading...
|
|
| JP |

|
Freund Corp
TSE:6312
|
16.9T JPY |
Loading...
|
Loading...
|
Loading...
|
|
| JP |

|
Mitsubishi Heavy Industries Ltd
TSE:7011
|
15.3T JPY |
Loading...
|
Loading...
|
Loading...
|
Return on Capital
Return on Capital Comparison
Atlas Copco AB Competitors
| Country | Company | Market Cap | ROE | ROA | ROCE | ROIC | ||
|---|---|---|---|---|---|---|---|---|
| SE |
|
Atlas Copco AB
STO:ATCO A
|
890.3B SEK |
Loading...
|
Loading...
|
Loading...
|
Loading...
|
|
| US |
|
Parker-Hannifin Corp
NYSE:PH
|
121.6B USD |
Loading...
|
Loading...
|
Loading...
|
Loading...
|
|
| US |
|
Illinois Tool Works Inc
NYSE:ITW
|
76.3B USD |
Loading...
|
Loading...
|
Loading...
|
Loading...
|
|
| US |
|
Ingersoll Rand Inc
NYSE:IR
|
32.6B USD |
Loading...
|
Loading...
|
Loading...
|
Loading...
|
|
| US |
|
Dover Corp
NYSE:DOV
|
29.1B USD |
Loading...
|
Loading...
|
Loading...
|
Loading...
|
|
| DE |
|
GEA Group AG
XETRA:G1A
|
10B EUR |
Loading...
|
Loading...
|
Loading...
|
Loading...
|
|
| JP |
F
|
Fujitec Co Ltd
TSE:6406
|
2 720 795.8T JPY |
Loading...
|
Loading...
|
Loading...
|
Loading...
|
|
| JP |
I
|
Ishii Iron Works Co Ltd
TSE:6362
|
304.2T JPY |
Loading...
|
Loading...
|
Loading...
|
Loading...
|
|
| JP |
S
|
Star Micronics Co Ltd
TSE:7718
|
48T JPY |
Loading...
|
Loading...
|
Loading...
|
Loading...
|
|
| JP |
|
Freund Corp
TSE:6312
|
16.9T JPY |
Loading...
|
Loading...
|
Loading...
|
Loading...
|
|
| JP |
|
Mitsubishi Heavy Industries Ltd
TSE:7011
|
15.3T JPY |
Loading...
|
Loading...
|
Loading...
|
Loading...
|
